I’m happy to share a new paper I co-authored, now out in Neurocomputing: “Neurospectrum: A geometric and topological deep learning framework for uncovering spatiotemporal signatures in neural activity.” First author Dhananjay Bhaskar and senior author Smita Krishnaswamy led a big team on this one, and I’m glad I got to be part of it. Below is a short plain-language summary, followed by a slide deck you can click through or download.
The problem
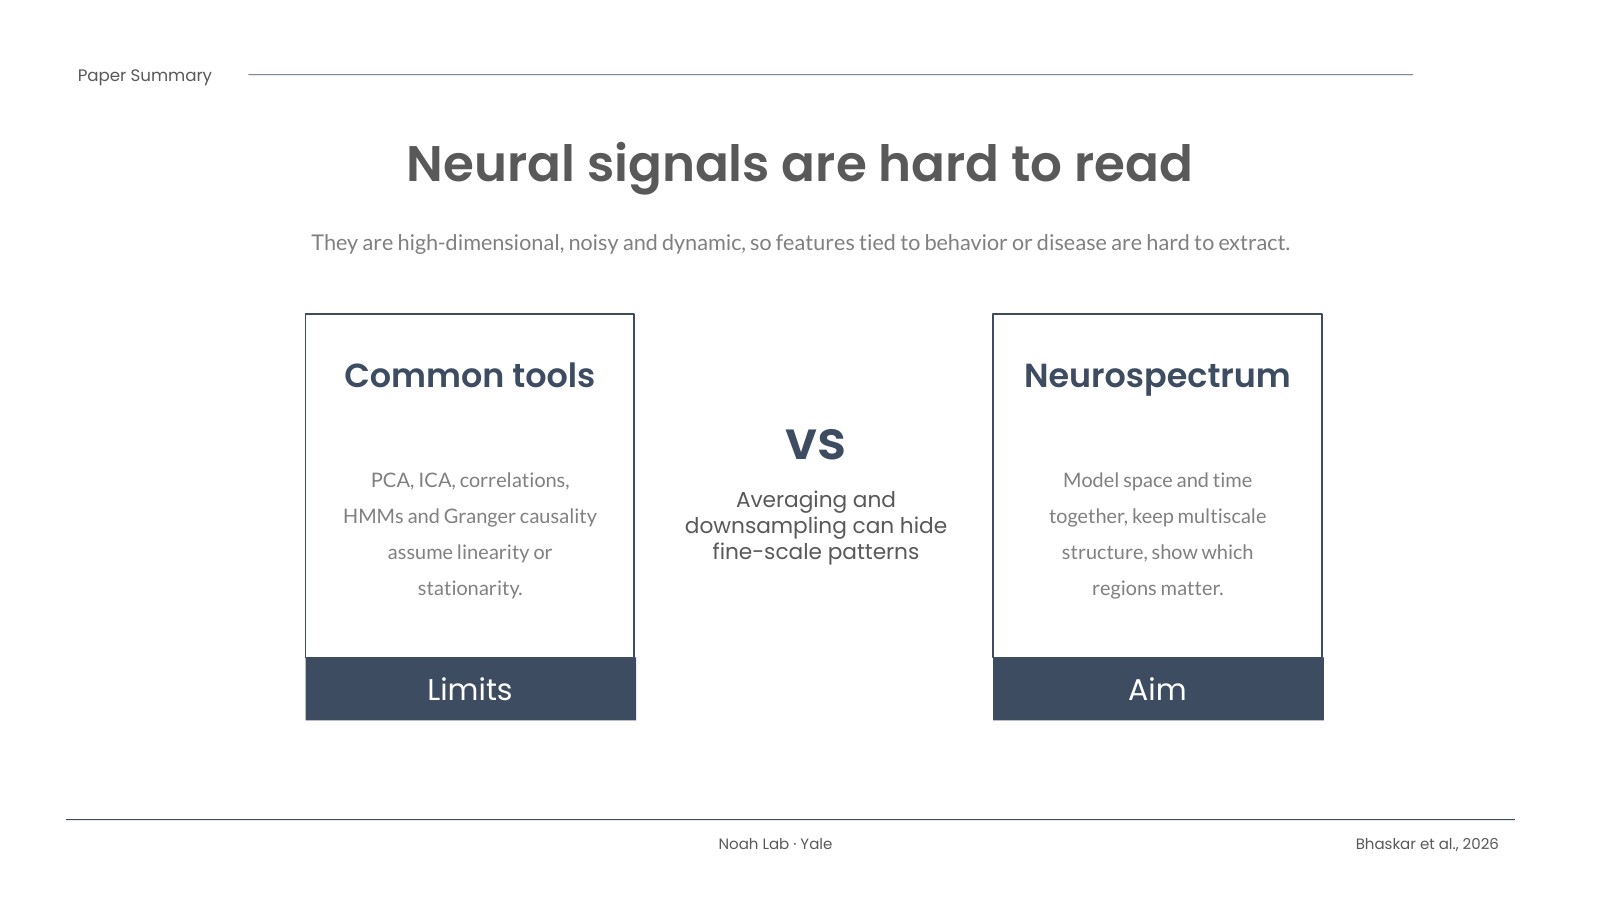
Brain recordings are messy. Whether it’s fMRI, calcium imaging, or the optical signals my lab works with, the data are high-dimensional, noisy, and always changing. Many of the standard tools, like PCA, ICA, and correlation-based connectivity, lean on assumptions such as linearity or stationarity, and they often average over space or time. That can wash out the fine-scale, moment-to-moment patterns we actually care about.
What we did
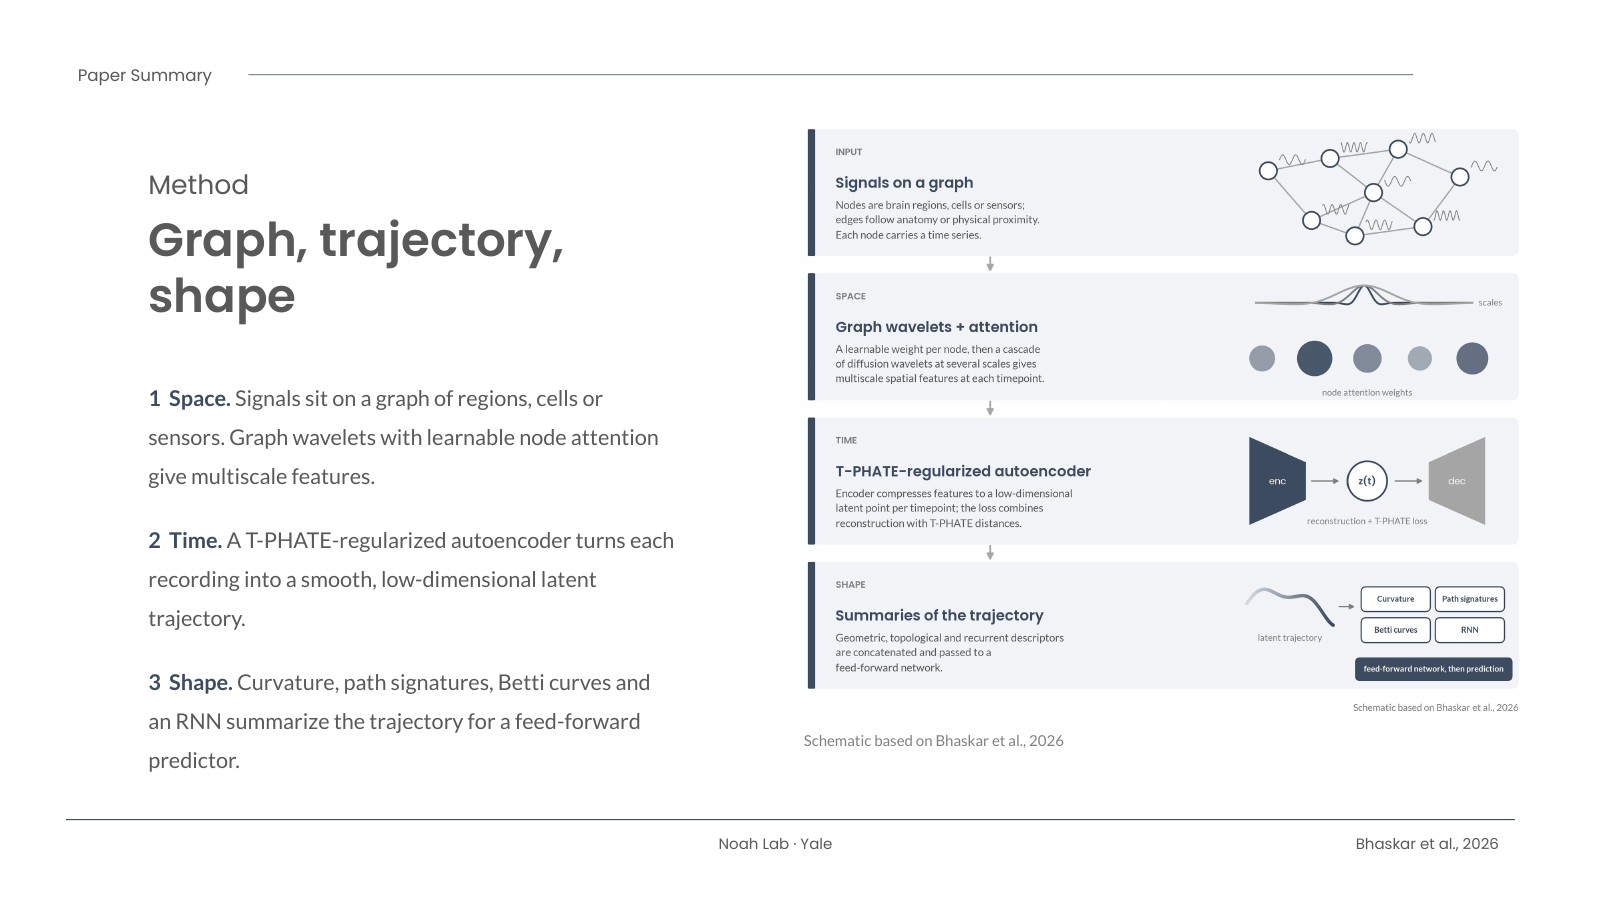
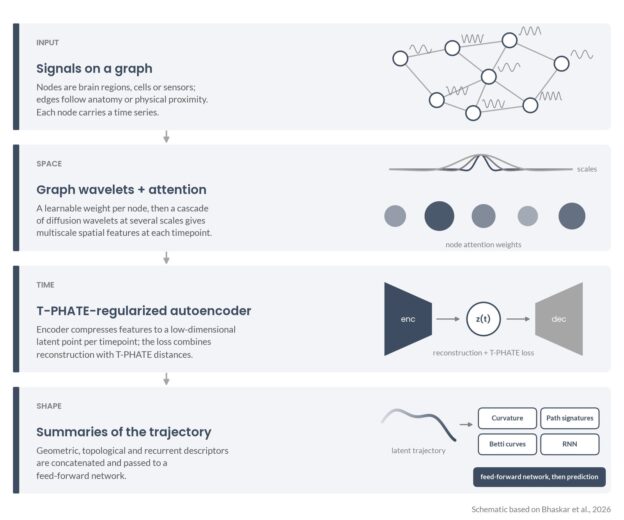
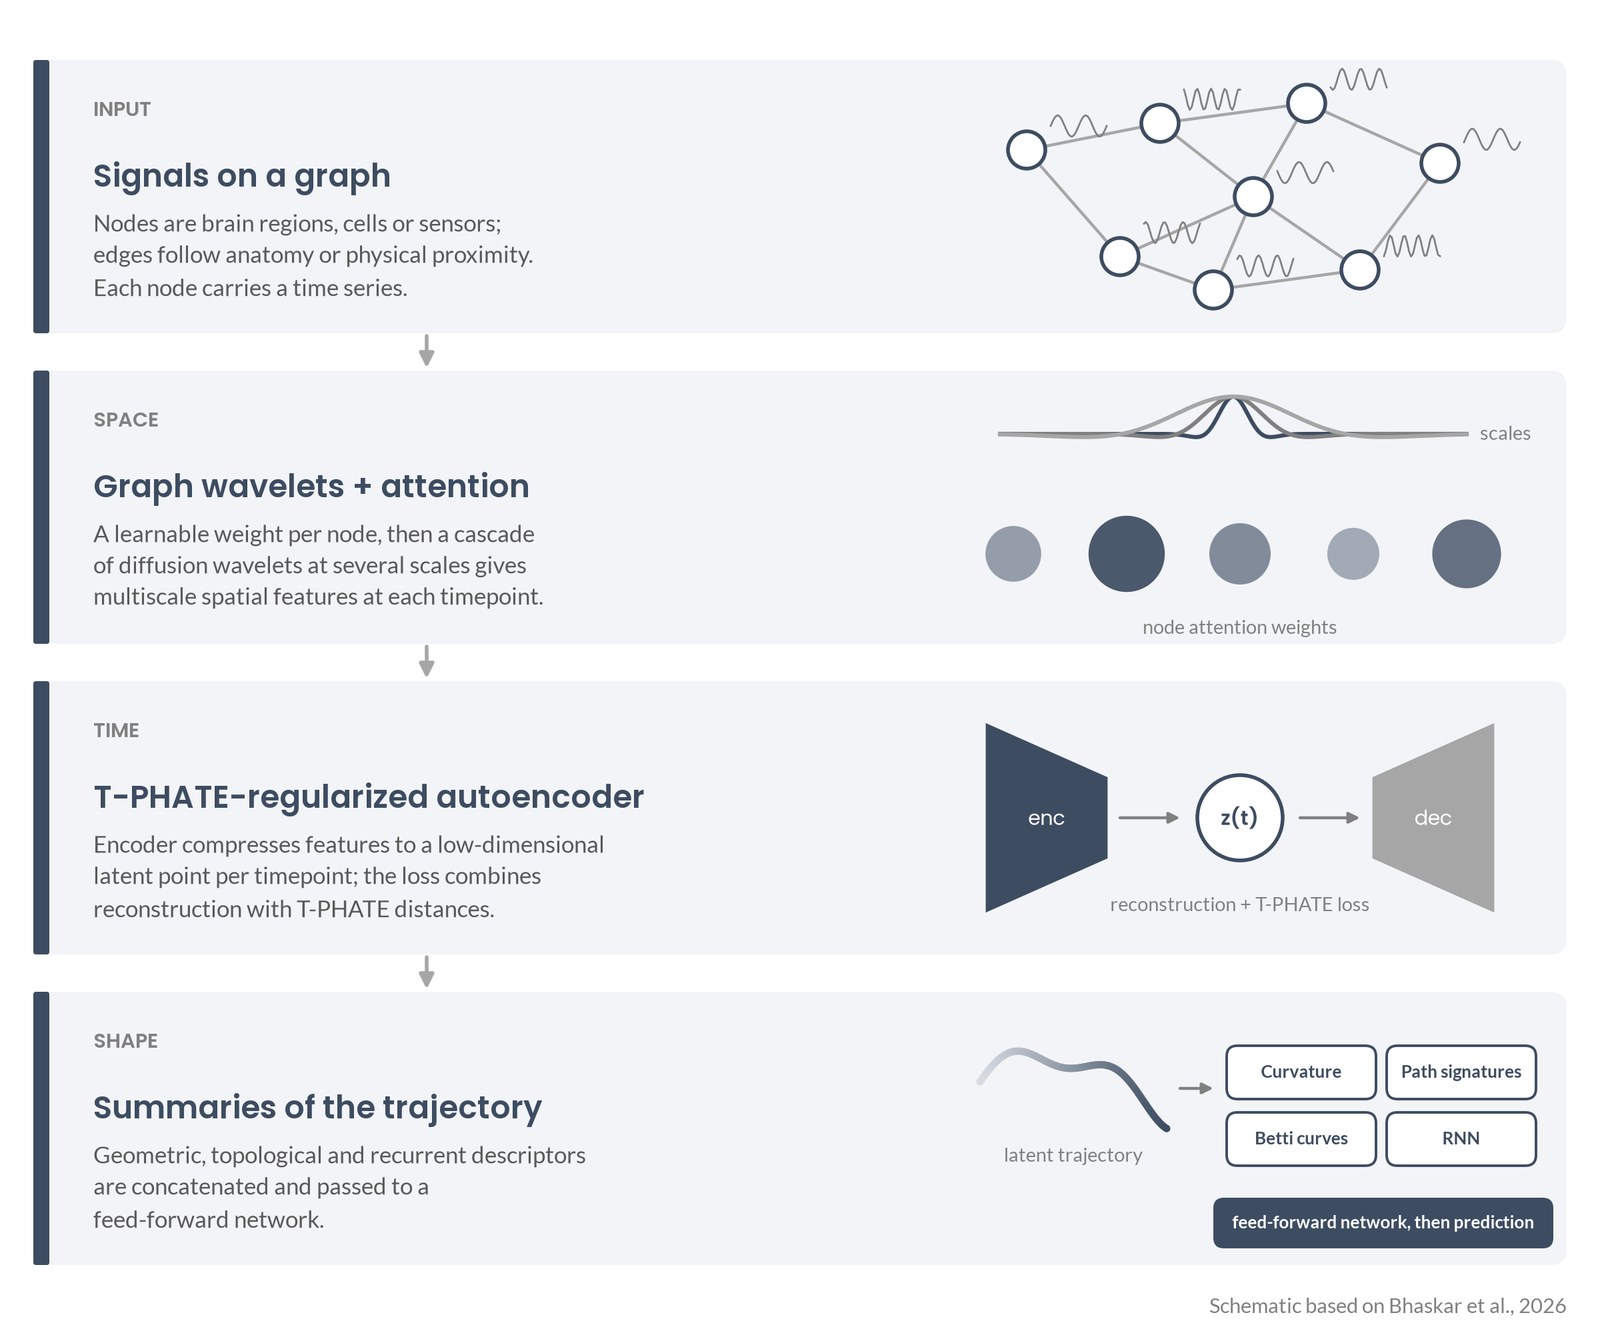
Neurospectrum treats brain activity as a path through time and then asks what shape that path has. It works in three steps:
- Space. At each moment, the signals sit on a graph of brain regions, cells, or sensors. Graph wavelets pick up patterns at several spatial scales, and a learnable attention step weights the regions that matter most.
- Time. An autoencoder, regularized with a manifold-learning method called T-PHATE, compresses each recording into a smooth, low-dimensional trajectory.
- Shape. The trajectory is summarized by its curvature (how sharply it turns), path signatures, Betti curves from persistent homology (its topology), and a recurrent network. Those features feed a small predictor.
The pieces are modular, so you can swap summaries in or out, and when they are differentiable the whole thing can be trained end to end.
What we found
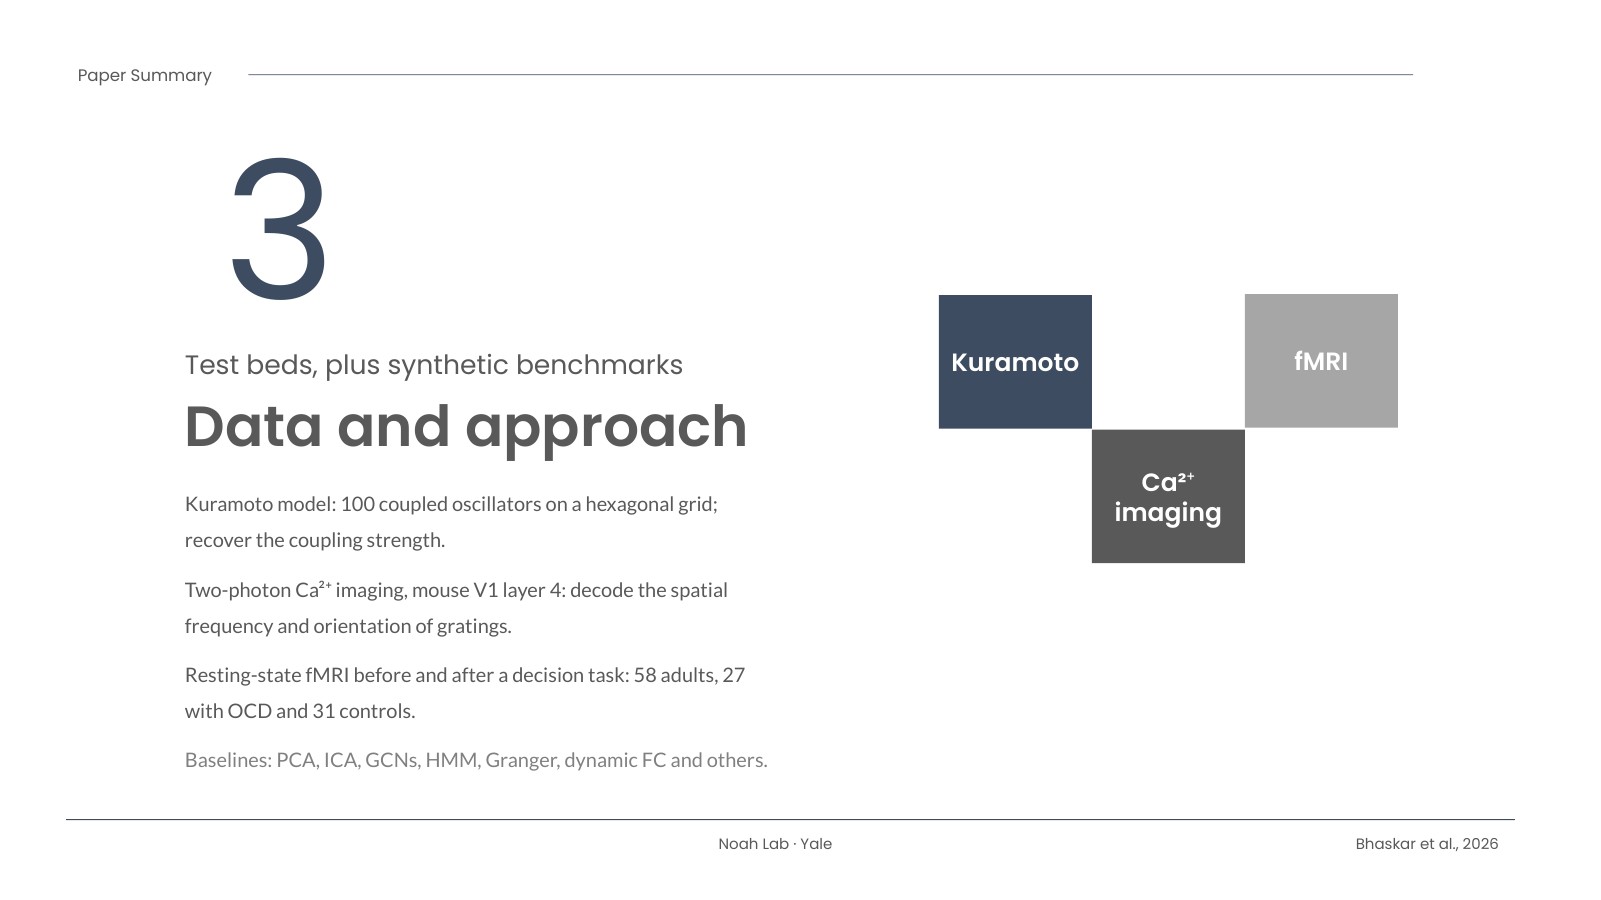
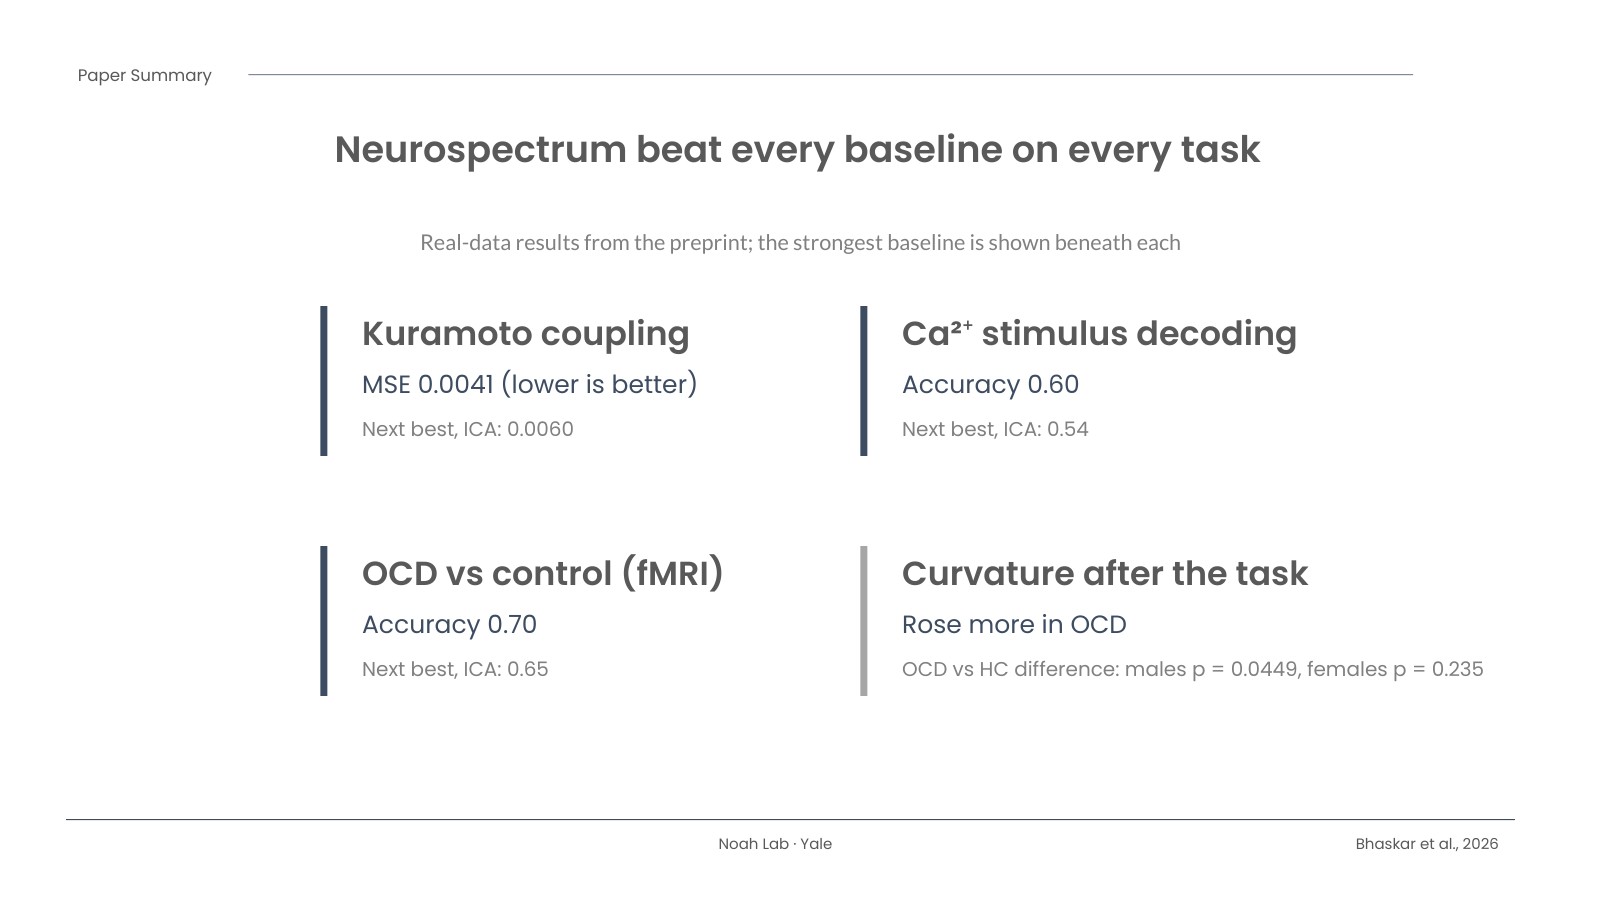
The team tested it on simulated coupled oscillators (the Kuramoto model, 100 oscillators), two-photon calcium imaging from mouse visual cortex, and resting-state fMRI collected before and after a decision-making task in 58 adults (27 with OCD, 31 healthy controls). Neurospectrum beat every baseline on every task. Recovering the oscillators’ coupling strength, its error was 0.0041 versus 0.0060 for the next-best method (ICA). Decoding the visual stimulus, accuracy was 0.60 versus 0.54. Telling OCD from control participants, accuracy was 0.70 versus 0.65.
The part I find most interesting: after the task, people’s brain trajectories bent more sharply, and that rise in curvature was larger in OCD. The group difference was statistically significant in males (p = 0.0449) but not in females (p = 0.235). The attention maps also pointed to different regions by sex, such as the posterior putamen in female participants and the superior frontal sulcus in male participants.
Why it matters
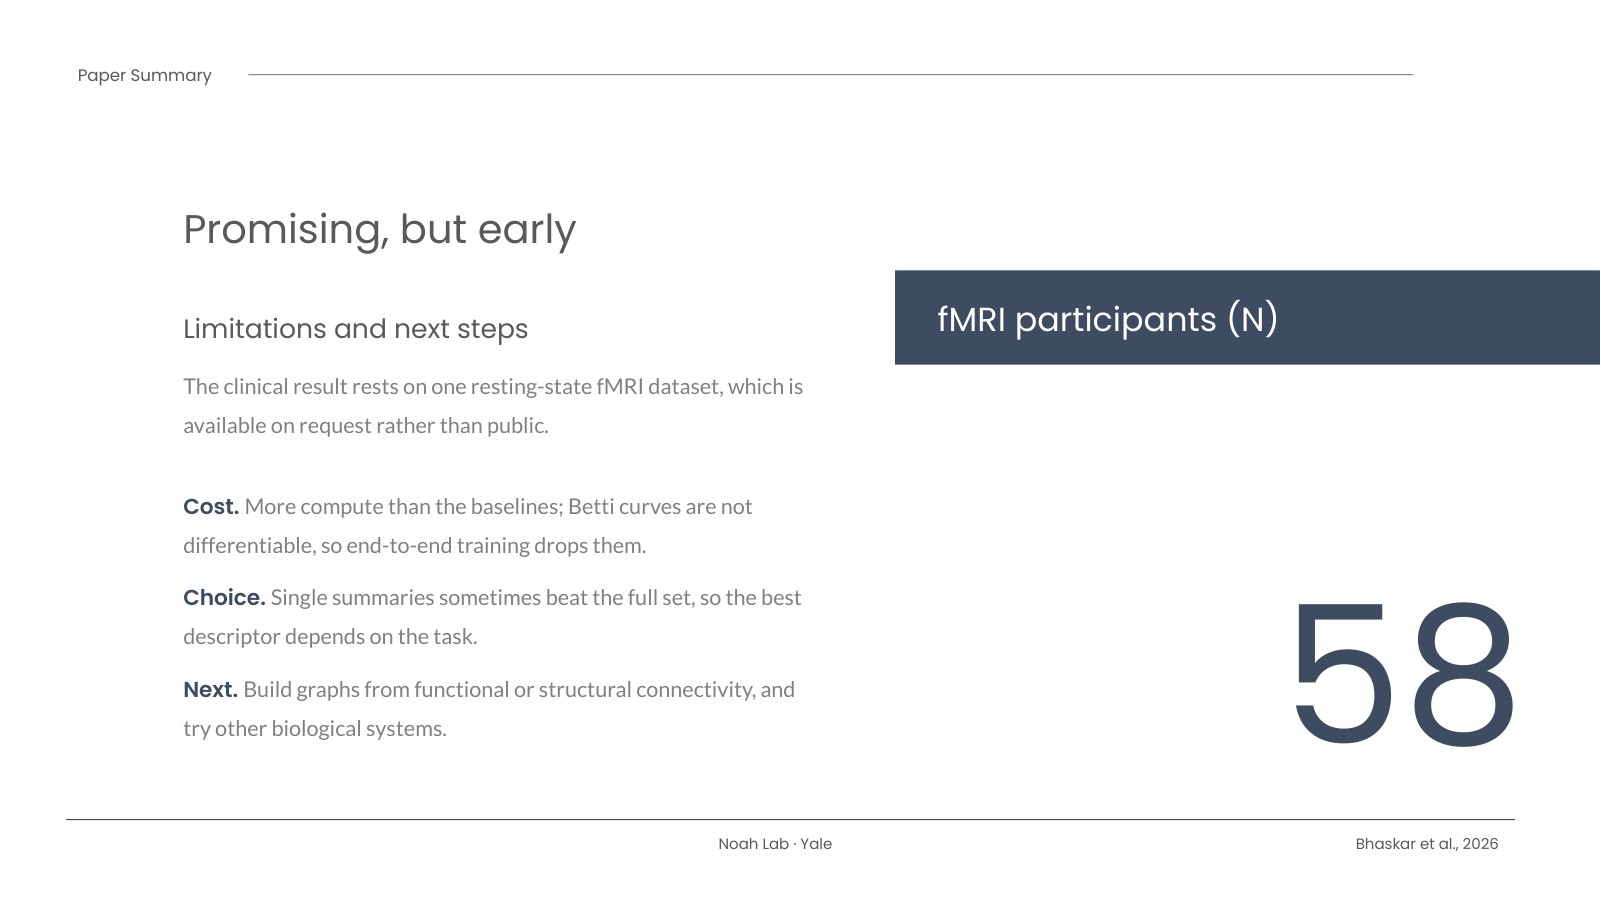
This isn’t just a better classifier. It produces features you can look at and reason about, like how much a brain state “turns” after a task, or which regions drive a difference. The paper didn’t use fNIRS, but the graph nodes can be sensor locations, and the wavelet step is designed to be robust to differences in sensor indexing and placement. That makes fNIRS optode montages a natural next test, and I’d like to try it. There are caveats: the clinical result rests on a single fMRI dataset, the method costs more compute than simpler tools, and the best summary feature depends on the task. The numbers above are from the open preprint, and the code is on GitHub.
Read the paper
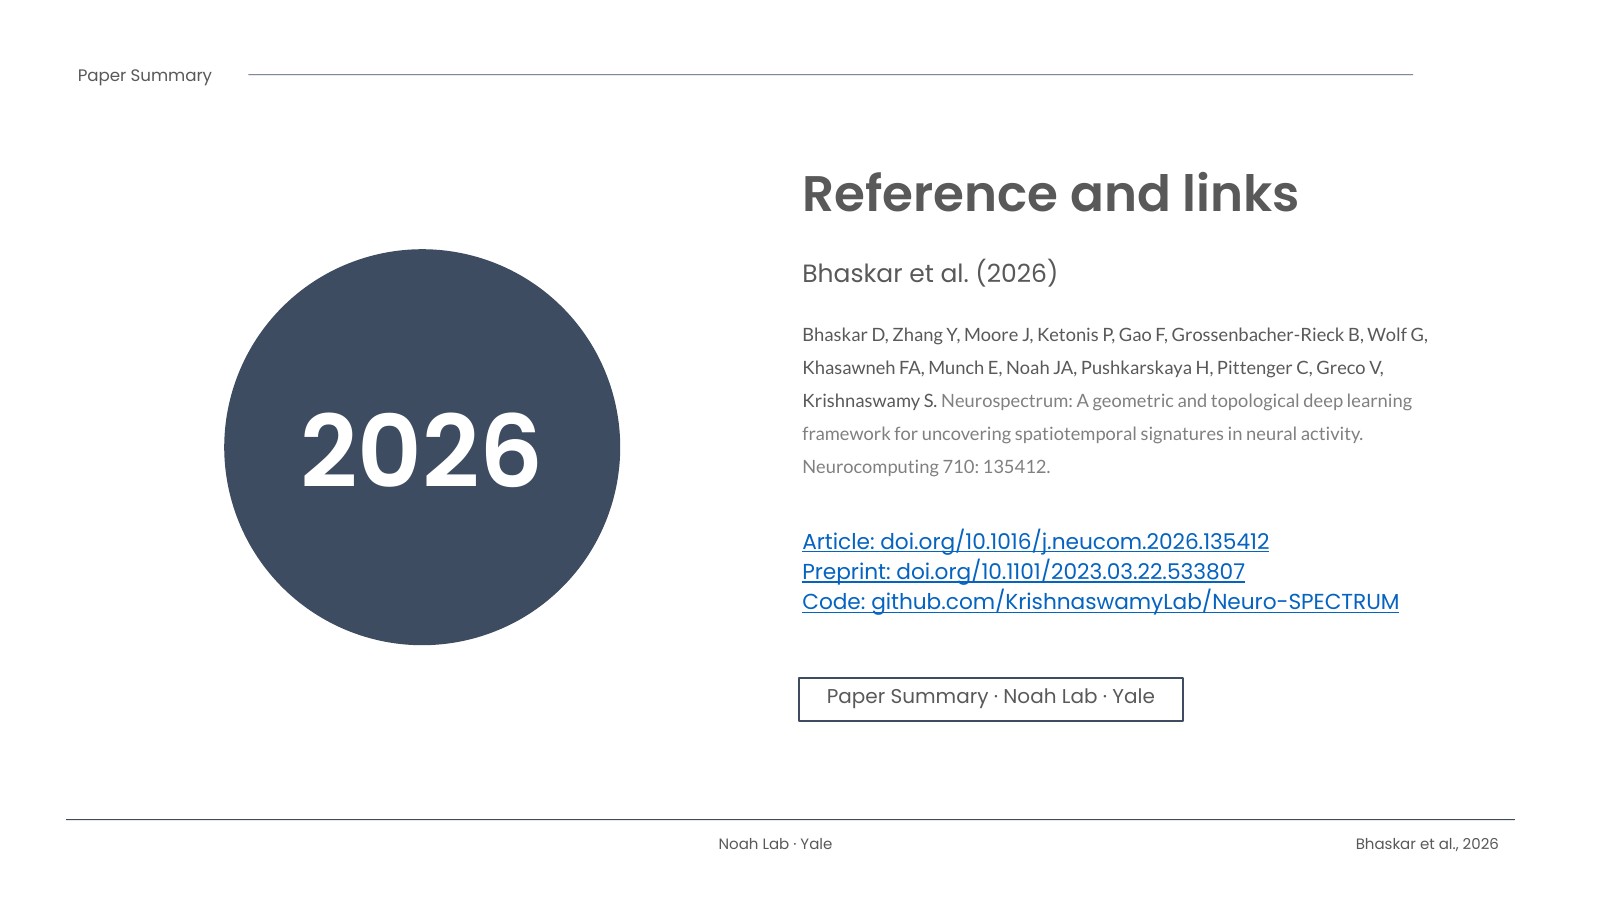
Article (DOI): https://doi.org/10.1016/j.neucom.2026.135412
Open preprint (bioRxiv): https://doi.org/10.1101/2023.03.22.533807
Citation: Bhaskar D, Zhang Y, Moore J, Ketonis P, Gao F, Grossenbacher-Rieck B, Wolf G, Khasawneh FA, Munch E, Noah JA, Pushkarskaya H, Pittenger C, Greco V, Krishnaswamy S. Neurospectrum: A geometric and topological deep learning framework for uncovering spatiotemporal signatures in neural activity. Neurocomputing. 2026;710:135412. doi:10.1016/j.neucom.2026.135412
The slides
Here is my eight-slide summary of the paper. Use the arrows, your keyboard’s arrow keys, or the thumbnails, and hit Fullscreen for a bigger view.