Category Archives: Neuroscience

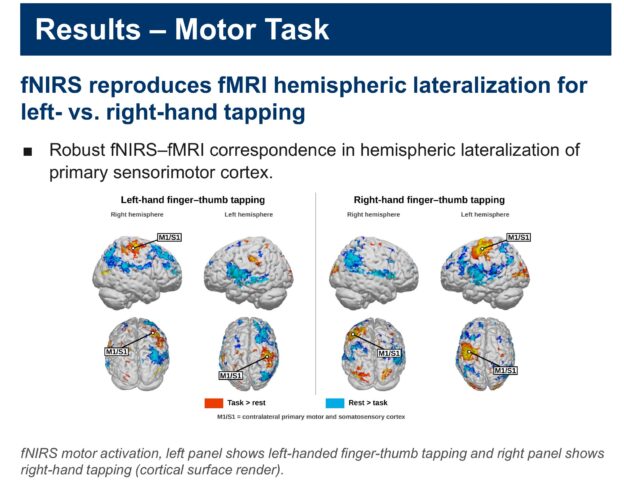
fNIRS motor-task activation for left- and right-hand finger-thumb tapping

Does fNIRS See What fMRI Sees? Our SfN 2026 Poster, Interactive

Next week I’ll be in Washington, D.C. for Neuroscience 2026, the Society for Neuroscience meeting, with a new poster from our lab: “fNIRS-fMRI Reliability for Motor and Social Perception Paradigms: Validation of fNIRS Against fMRI.” It asks a simple question that sits under almost everything we do: when fNIRS says part of the brain is active, does fMRI agree? Below is a plain-language summary and an interactive version of the poster you can click through.

The question

Our lab uses fNIRS (functional near-infrared spectroscopy), which measures hemodynamic, or blood-flow, responses with optodes placed on the scalp. Its big advantage is that it lets us study people in natural situations, including live, face-to-face interaction, which is exactly what developmental and social neuroscience needs. But fMRI is still the reference standard, and fNIRS needs to be checked against it systematically, on more than simple reference tasks. So we compared the two directly.

What we did

We used two calibrated benchmark tasks and ran each one with fNIRS (a Shimadzu LABNIRS system) and with fMRI (a Siemens MAGNETOM Prisma 3T).

  • Finger-thumb tapping. People tapped with the left hand or the right hand in 15-second blocks with 15 seconds of rest, for 6 minutes, with the same timing for fNIRS and fMRI. This is a focal test: it should light up primary sensorimotor cortex on the side opposite the hand.
  • Dynamic faces. People watched short videos of children’s faces smiling, moving and chewing (stimuli from Pitcher and colleagues, 2011). This targets the face network, especially the posterior superior temporal sulcus (pSTS), a region that is central to social perception.
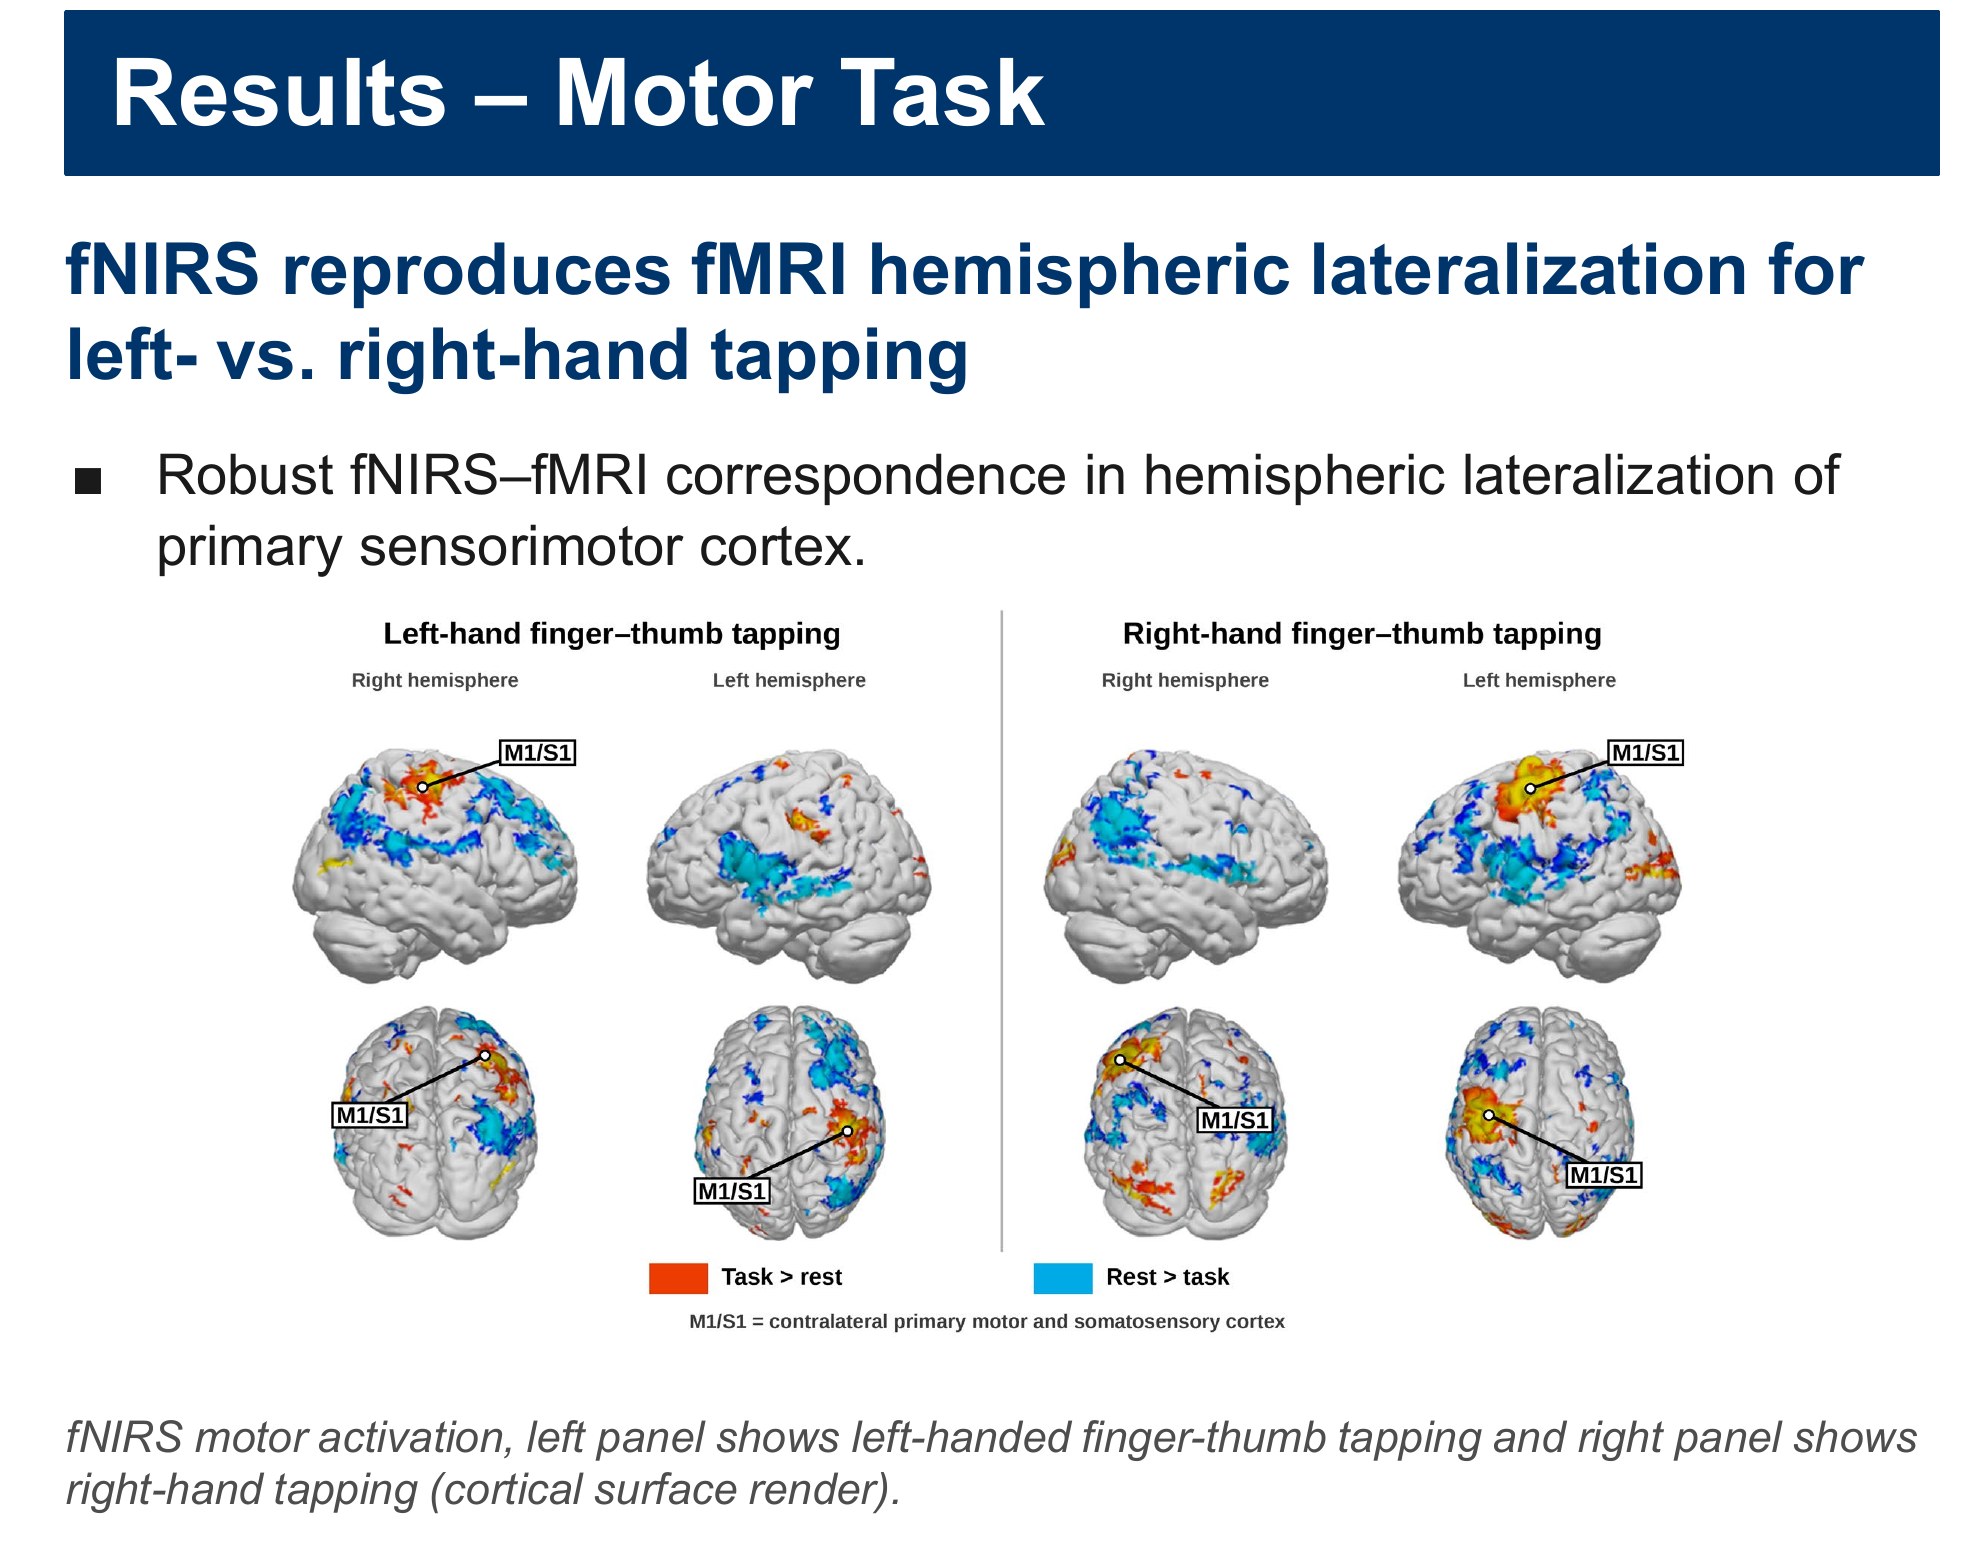
fNIRS motor-task activation on the cortical surface for left-hand and right-hand finger-thumb tapping, with primary sensorimotor cortex (M1/S1) labelled
From the poster: fNIRS reproduces the left/right pattern of the motor task. Left panel, left-hand tapping; right panel, right-hand tapping.

What we found

For the motor task, fNIRS reproduced the hemispheric lateralization seen with fMRI: left-hand tapping drove the right primary sensorimotor cortex and right-hand tapping drove the left, with robust correspondence between the two methods.

For the face videos, both fNIRS and fMRI picked up the dynamic-face network, including multiple sites along the pSTS. fNIRS reliably detected activity in visual and lateral-occipital cortex and in the superior and middle temporal lobes, with high spatial correspondence to the fMRI BOLD signal. Overall, the two methods showed strong spatial agreement in both tasks.

We are also working on the depth question. Continuous-wave fNIRS sees superficial cortex, roughly half the distance between a source and a detector, while fMRI is fully 3D. Using one participant’s own fMRI and anatomical scans together with a NeuroDOT sensitivity model, we are building a pipeline to estimate how well fNIRS reaches the superficial and deeper parts of the fusiform face area and the pSTS.

Why it matters

In the scanner, social stimuli have to be recorded video, and that removes two things that define a real social exchange: a recorded face can’t return your eye contact, and it can’t react to or mirror your expressions. fNIRS has neither limit, so we can study live, face-to-face interaction with real two-way gaze and facial expression. Showing that fNIRS agrees with fMRI on these benchmarks supports using it in developmental settings where fMRI is impractical and where ecological validity really matters. The honest caveat is depth: fNIRS measures cortex only to a limited depth, and any comparison with fMRI has to take that into account.

Explore the poster

Click any part of the poster to open a zoomed-in, high-resolution view of that panel with a short explanation, then use Next and Previous (or your arrow keys) to step through it in reading order. Guided tour walks you through the whole thing from the top, and you can zoom, pan or go fullscreen on the full poster. On a phone, use the list of sections under the poster. Press Esc to close a panel.
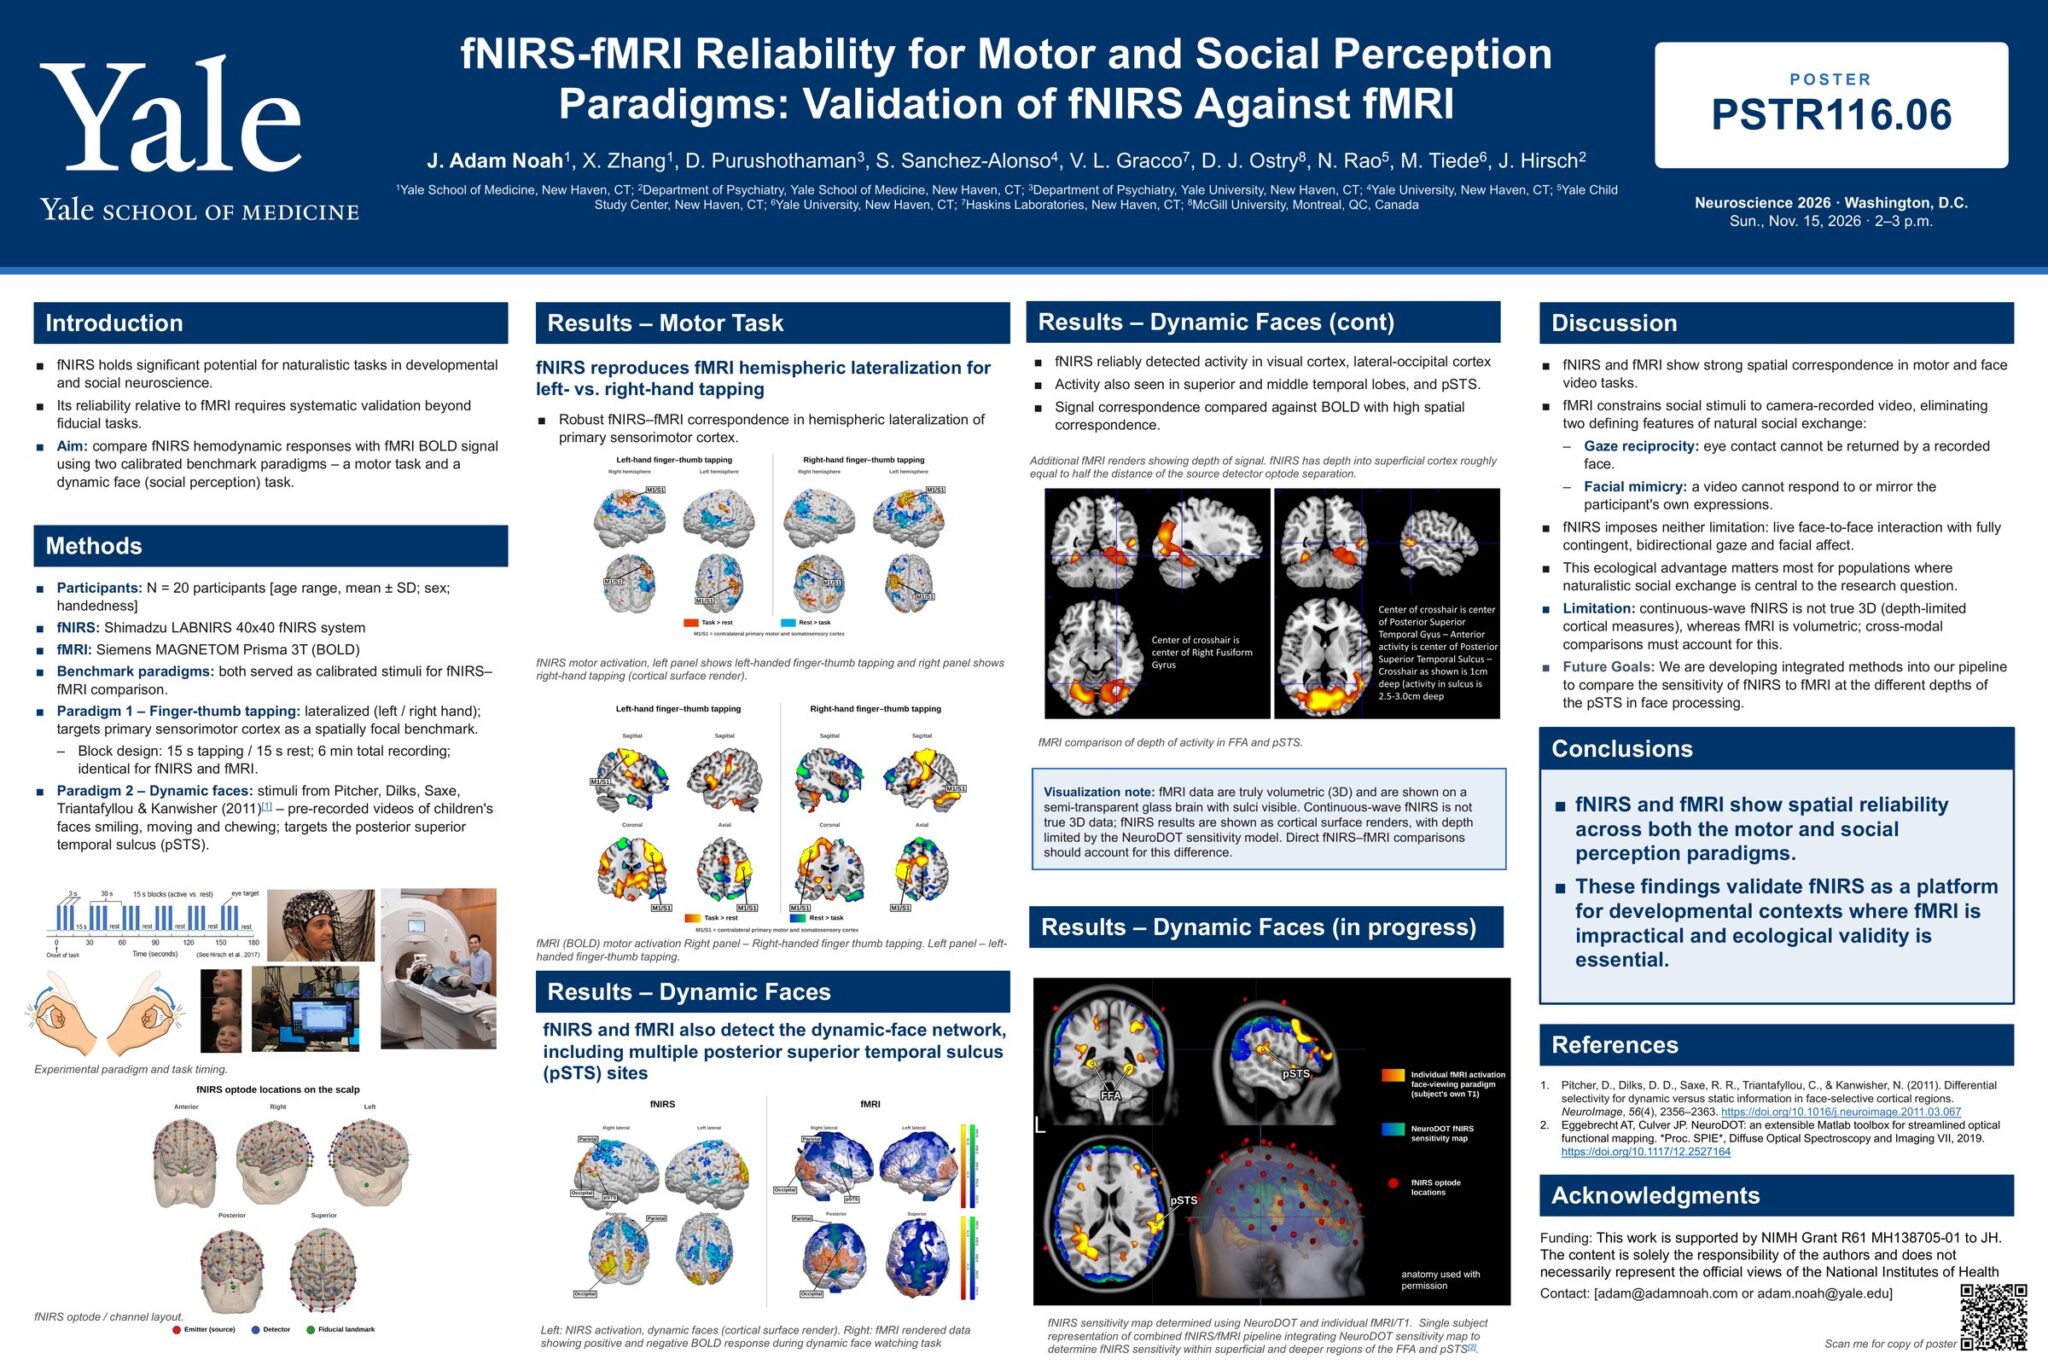
Click any part of the poster to open it. In a panel, click the image to see it full size.
The full SfN 2026 poster. Each section is a clickable region.

Our poster for Neuroscience 2026 in Washington, D.C.: fNIRS-fMRI Reliability for Motor and Social Perception Paradigms: Validation of fNIRS Against fMRI. It is poster PSTR116.06, listed for Sunday, Nov. 15, 2026, 2–3 p.m.

Authors: J. Adam Noah, X. Zhang, D. Purushothaman, S. Sanchez-Alonso, V. L. Gracco, D. J. Ostry, N. Rao, M. Tiede and J. Hirsch, from the Yale School of Medicine, Yale University, the Yale Child Study Center, Haskins Laboratories and McGill University.

fNIRS (functional near-infrared spectroscopy) has a lot of promise for natural, real-world tasks in developmental and social neuroscience. But before we lean on it, we need to know how well it agrees with fMRI, and that has to be tested on more than simple reference tasks.

The aim: compare fNIRS hemodynamic (blood-flow) responses with the fMRI BOLD signal using two calibrated benchmark tasks, one motor task and one dynamic-face (social perception) task.

The same benchmark tasks were run with fNIRS (a Shimadzu LABNIRS system) and with fMRI (a Siemens MAGNETOM Prisma 3T scanner).

  • Task 1, finger-thumb tapping: left hand or right hand, a focal benchmark for primary sensorimotor cortex. Blocks of 15 s tapping and 15 s rest, 6 minutes in total, identical for fNIRS and fMRI.
  • Task 2, dynamic faces: pre-recorded videos of children’s faces smiling, moving and chewing (stimuli from Pitcher et al., 2011), aimed at the posterior superior temporal sulcus (pSTS).

The figure shows the task timing and the recording setups.

Where the fNIRS sensors sit. The scalp models show the optode layout from the front, right, left, back and top. Red dots are emitters (light sources), blue dots are detectors, and green dots are fiducial landmarks used to line the cap up on the head.

fNIRS reproduces the left/right pattern seen in fMRI. When people tapped with the left hand, activity showed up in the right primary sensorimotor cortex (labelled M1/S1), and the reverse for the right hand.

These are fNIRS results drawn on the cortical surface: left panel for left-hand tapping, right panel for right-hand tapping. Warm colors are task > rest; blue is rest > task.

The same tapping task measured with fMRI (BOLD), shown in sagittal, coronal and axial slices. The M1/S1 labels mark primary sensorimotor cortex on the side opposite the tapping hand, which is the pattern fNIRS picked up in the previous panel. Together they show robust fNIRS–fMRI agreement in hemispheric lateralization.

Both methods pick up the face network. While people watched the dynamic face videos, fNIRS (left) and fMRI (right) both detected the dynamic-face network, including multiple sites along the posterior superior temporal sulcus (pSTS). The fMRI renders show both positive and negative BOLD responses.

fNIRS reliably detected activity in visual cortex and lateral-occipital cortex, and also in the superior and middle temporal lobes and pSTS, with high spatial correspondence to the fMRI BOLD signal.

The fMRI slices show how deep that activity sits. One crosshair marks the right fusiform gyrus; the other marks the pSTS, where the crosshair is about 1 cm deep and activity in the sulcus is 2.5–3.0 cm deep. fNIRS reaches into superficial cortex, roughly half the distance between a source and a detector optode.

A note on the pictures. fMRI data are truly 3D, so they are shown in a semi-transparent glass brain with the sulci visible. Continuous-wave fNIRS is not true 3D data, so its results are drawn on the cortical surface, with depth limited by the NeuroDOT sensitivity model. Any direct fNIRS–fMRI comparison has to account for that difference.

Work in progress: how deep can fNIRS see? For a single participant, we combined that person’s own fMRI and T1 anatomical scans with a NeuroDOT fNIRS sensitivity map. Overlaying the fMRI face activation, the fNIRS sensitivity and the optode positions lets us estimate how sensitive fNIRS is to the superficial and deeper parts of two face areas, the fusiform face area (FFA) and the pSTS.

fNIRS and fMRI line up well in space for both the motor task and the face-video task.

Why that matters: in the scanner, social stimuli have to be recorded video, which removes two defining parts of real social exchange. A recorded face can’t return your eye contact (gaze reciprocity), and it can’t respond to or mirror your expressions (facial mimicry). fNIRS has neither limit, so we can study live, face-to-face interaction with real two-way gaze and facial expression. That matters most for groups where natural social exchange is central to the question.

The limitation: continuous-wave fNIRS only measures cortex to a limited depth, while fMRI is volumetric. Next, we are building methods into our pipeline to compare fNIRS and fMRI sensitivity at different depths of the pSTS during face processing.

The take-home: fNIRS and fMRI show spatial reliability across both the motor and the social perception tasks. That supports fNIRS as a platform for developmental settings where fMRI is impractical and ecological validity is essential.

The face videos come from Pitcher, Dilks, Saxe, Triantafyllou & Kanwisher (2011, NeuroImage), and the sensitivity modelling uses the NeuroDOT toolbox (Eggebrecht & Culver, 2019).

This work is supported by NIMH Grant R61 MH138705-01 to J. Hirsch. The content is solely the responsibility of the authors and does not necessarily represent the official views of the National Institutes of Health.
Download the full poster (PDF)

Come by if you’re at SfN

If you’re at Neuroscience 2026 in Washington, D.C., come find me at poster PSTR116.06 on Sunday, November 15. I’ll be at the poster from 1 p.m. (the time printed on the poster is 2–3 p.m.). Stop by and talk with me about what the lab is doing; I’d love to hear what you’re working on too.

Poster details

Title: fNIRS-fMRI Reliability for Motor and Social Perception Paradigms: Validation of fNIRS Against fMRI
Authors: J. Adam Noah, X. Zhang, D. Purushothaman, S. Sanchez-Alonso, V. L. Gracco, D. J. Ostry, N. Rao, M. Tiede, J. Hirsch
Affiliations: Yale School of Medicine; Department of Psychiatry, Yale School of Medicine; Department of Psychiatry, Yale University; Yale University; Yale Child Study Center; Haskins Laboratories; McGill University
Poster: PSTR116.06, Neuroscience 2026, Washington, D.C., Sun., Nov. 15, 2026, 2–3 p.m.

This work is supported by NIMH Grant R61 MH138705-01 to J. Hirsch. The content is solely the responsibility of the authors and does not necessarily represent the official views of the National Institutes of Health.
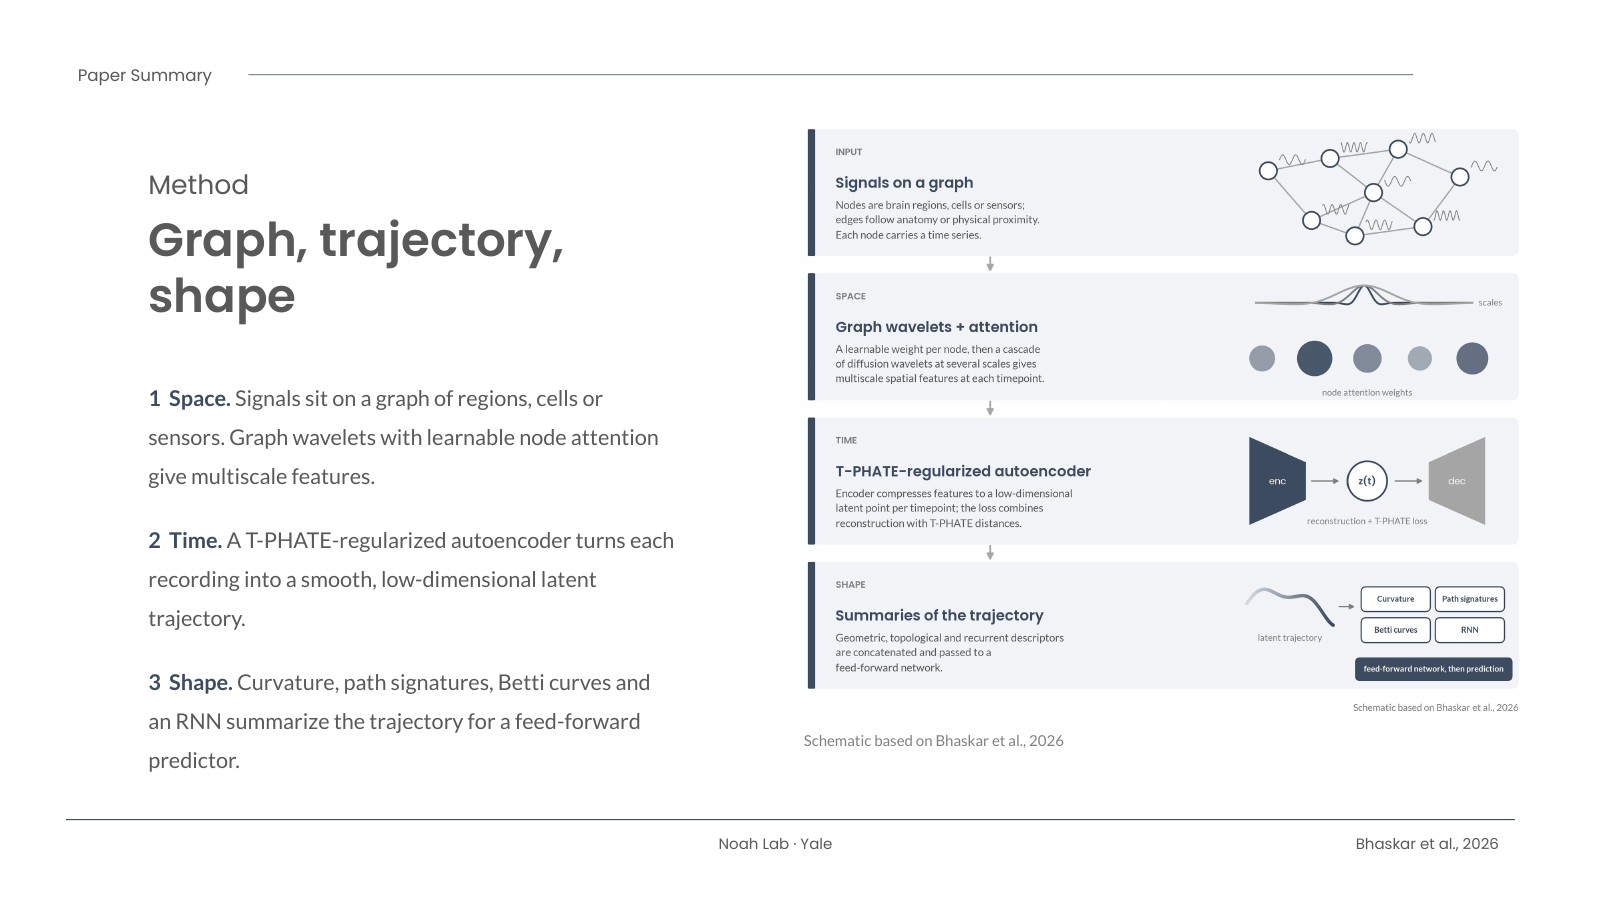
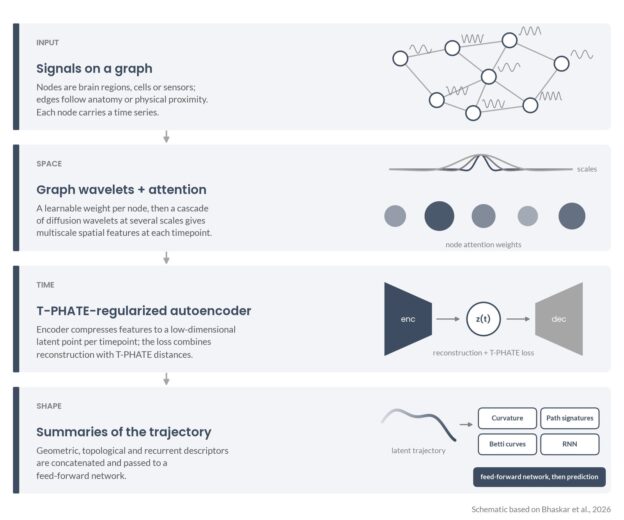
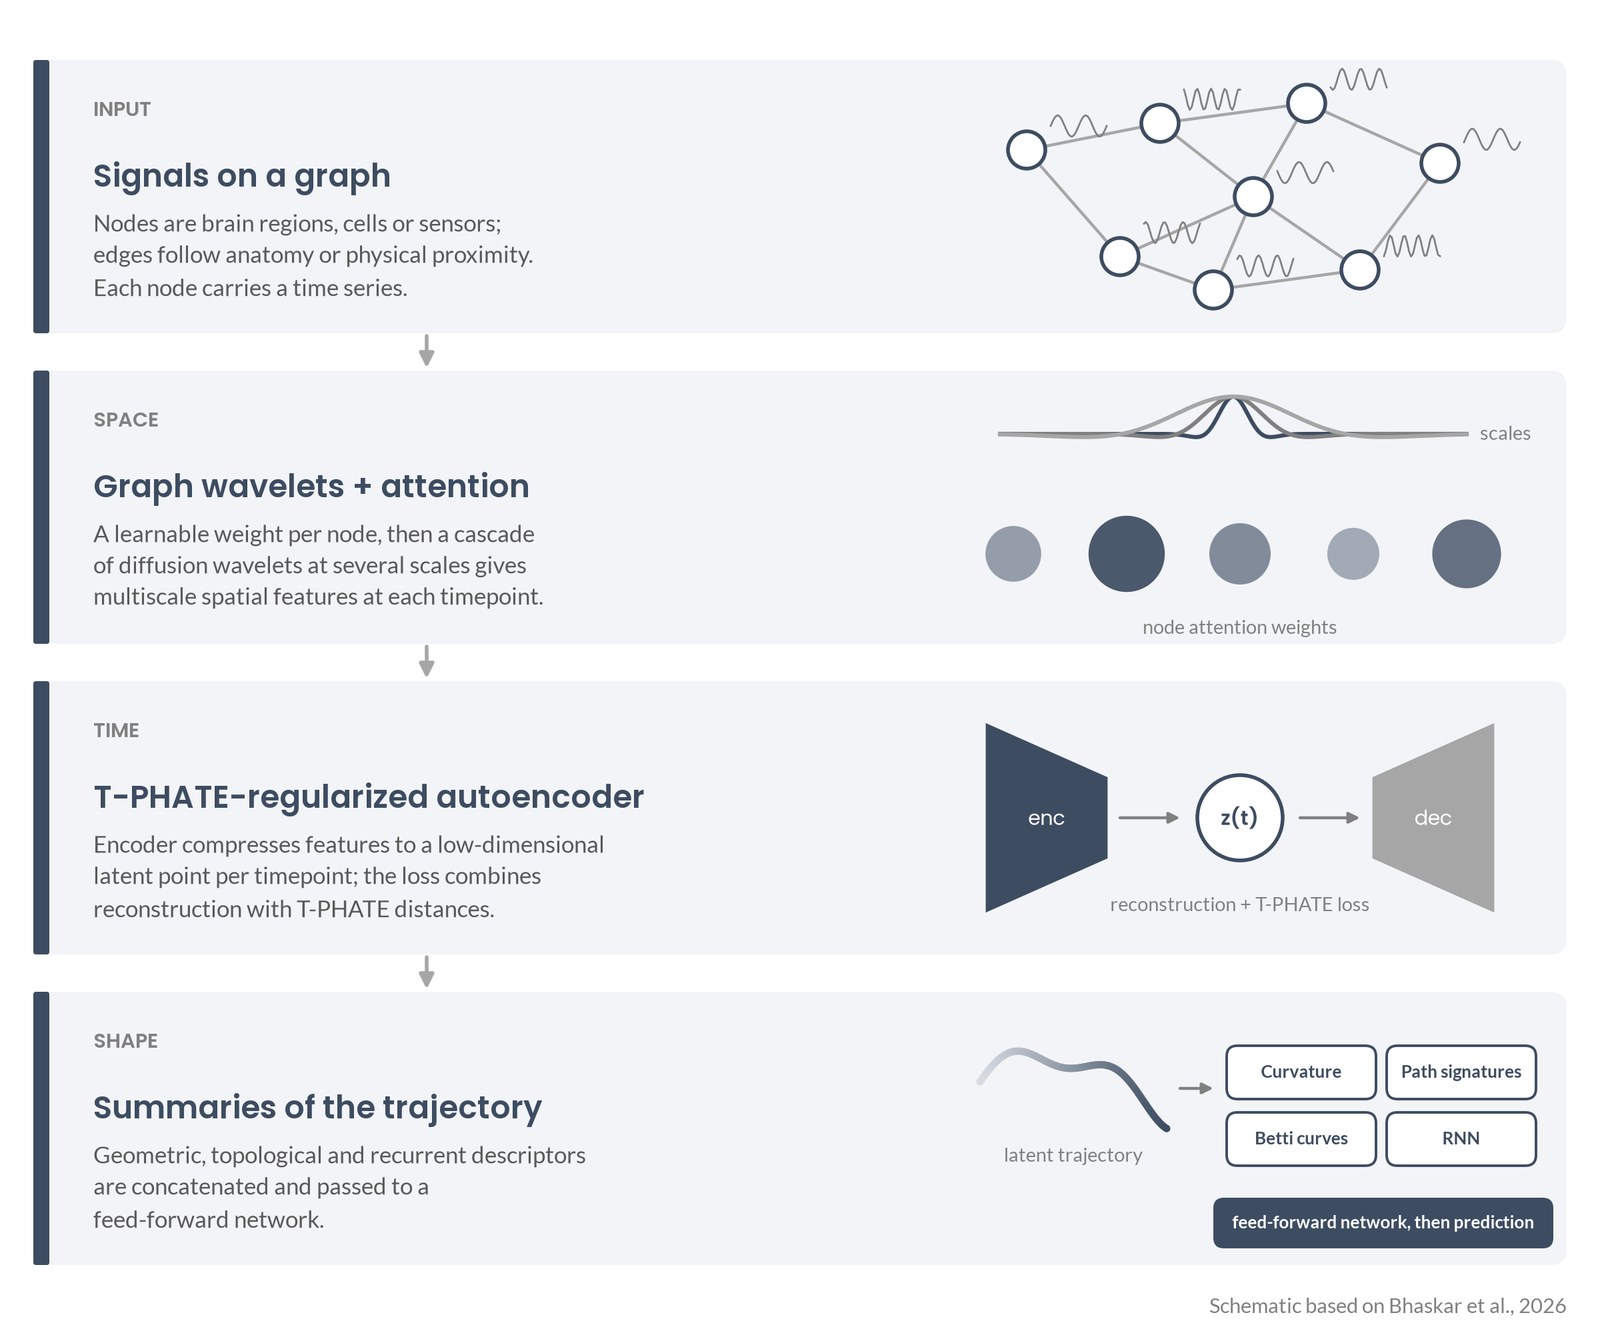
Schematic of the Neurospectrum pipeline in four stacked steps: signals on a graph; graph wavelets with node attention; a T-PHATE-regularized autoencoder producing a latent trajectory; curvature, path signatures, Betti curves and RNN summaries feeding a feed-forward network

Reading the Shape of Brain Activity: Our Neurospectrum Paper

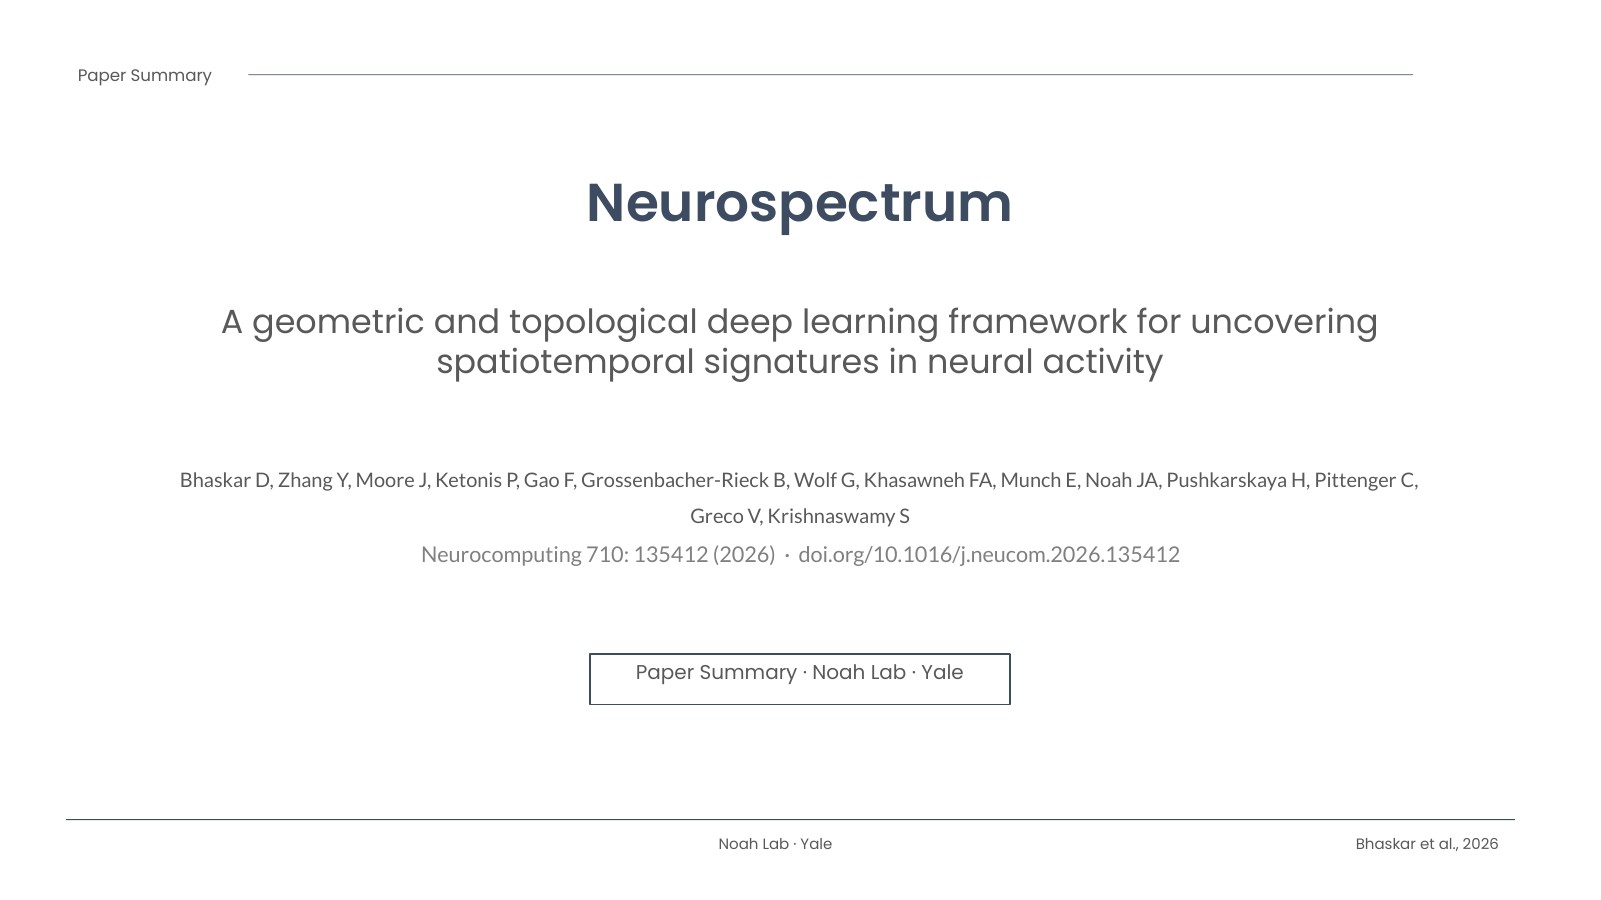
I’m happy to share a new paper I co-authored, now out in Neurocomputing: “Neurospectrum: A geometric and topological deep learning framework for uncovering spatiotemporal signatures in neural activity.” First author Dhananjay Bhaskar and senior author Smita Krishnaswamy led a big team on this one, and I’m glad I got to be part of it. Below is a short plain-language summary, followed by a slide deck you can click through or download.

Schematic of the Neurospectrum pipeline in four stacked steps: signals on a graph; graph wavelets with node attention; a T-PHATE-regularized autoencoder producing a latent trajectory; curvature, path signatures, Betti curves and RNN summaries feeding a feed-forward network
Schematic based on Bhaskar et al., 2026: how Neurospectrum goes from signals on a graph to a trajectory and its shape. My own drawing, based on the paper’s description.

The problem

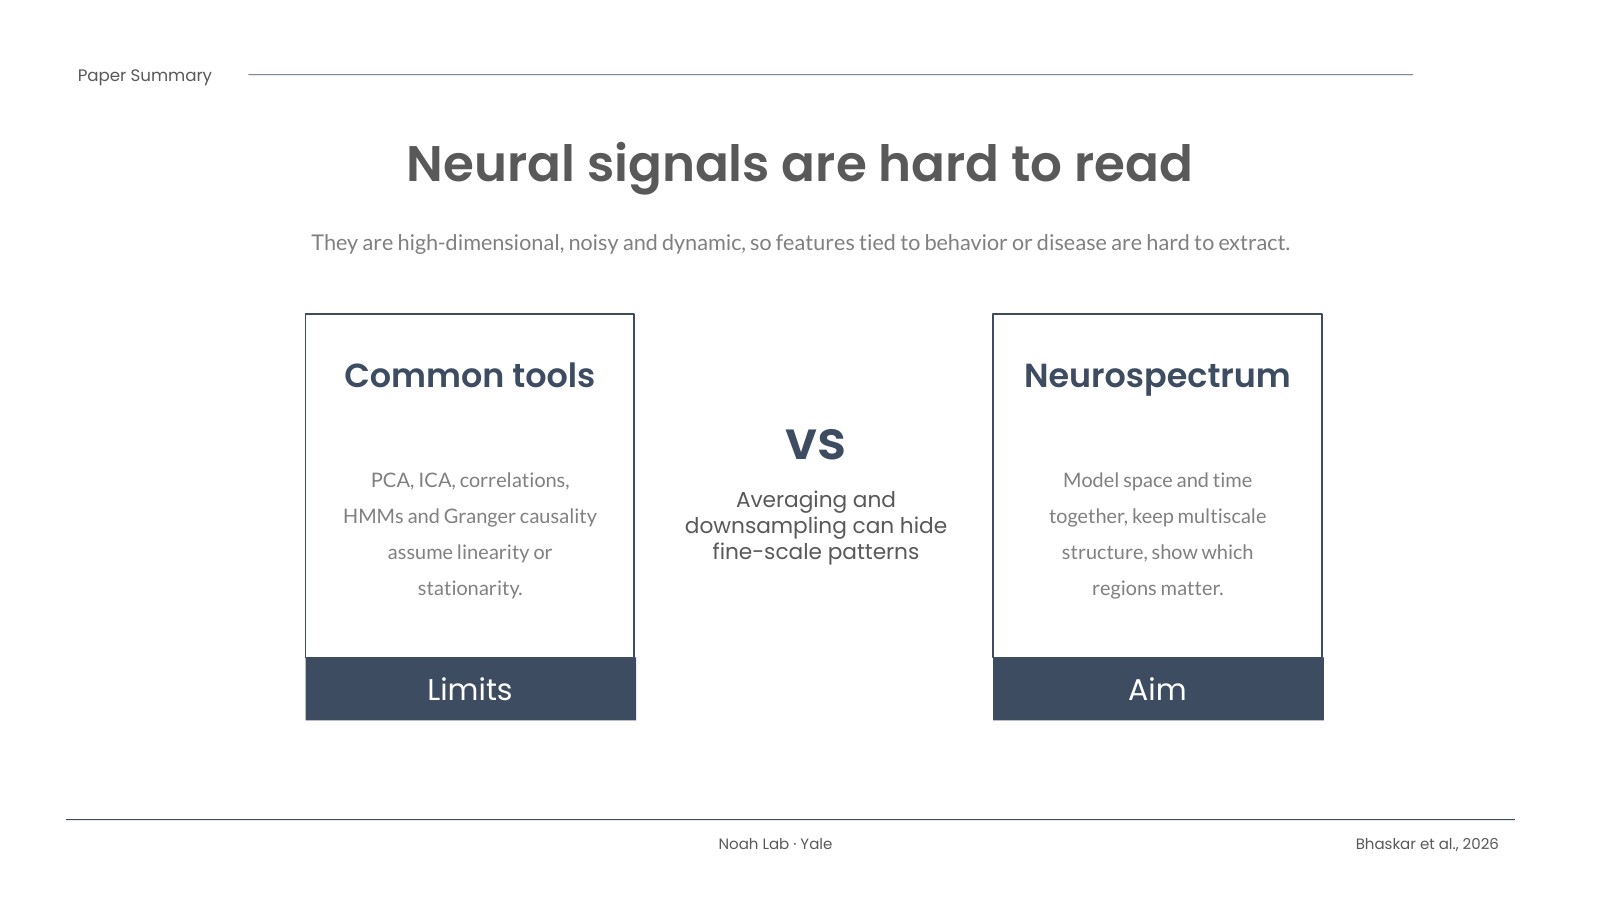
Brain recordings are messy. Whether it’s fMRI, calcium imaging, or the optical signals my lab works with, the data are high-dimensional, noisy, and always changing. Many of the standard tools, like PCA, ICA, and correlation-based connectivity, lean on assumptions such as linearity or stationarity, and they often average over space or time. That can wash out the fine-scale, moment-to-moment patterns we actually care about.

What we did

Neurospectrum treats brain activity as a path through time and then asks what shape that path has. It works in three steps:

  • Space. At each moment, the signals sit on a graph of brain regions, cells, or sensors. Graph wavelets pick up patterns at several spatial scales, and a learnable attention step weights the regions that matter most.
  • Time. An autoencoder, regularized with a manifold-learning method called T-PHATE, compresses each recording into a smooth, low-dimensional trajectory.
  • Shape. The trajectory is summarized by its curvature (how sharply it turns), path signatures, Betti curves from persistent homology (its topology), and a recurrent network. Those features feed a small predictor.

The pieces are modular, so you can swap summaries in or out, and when they are differentiable the whole thing can be trained end to end.

What we found

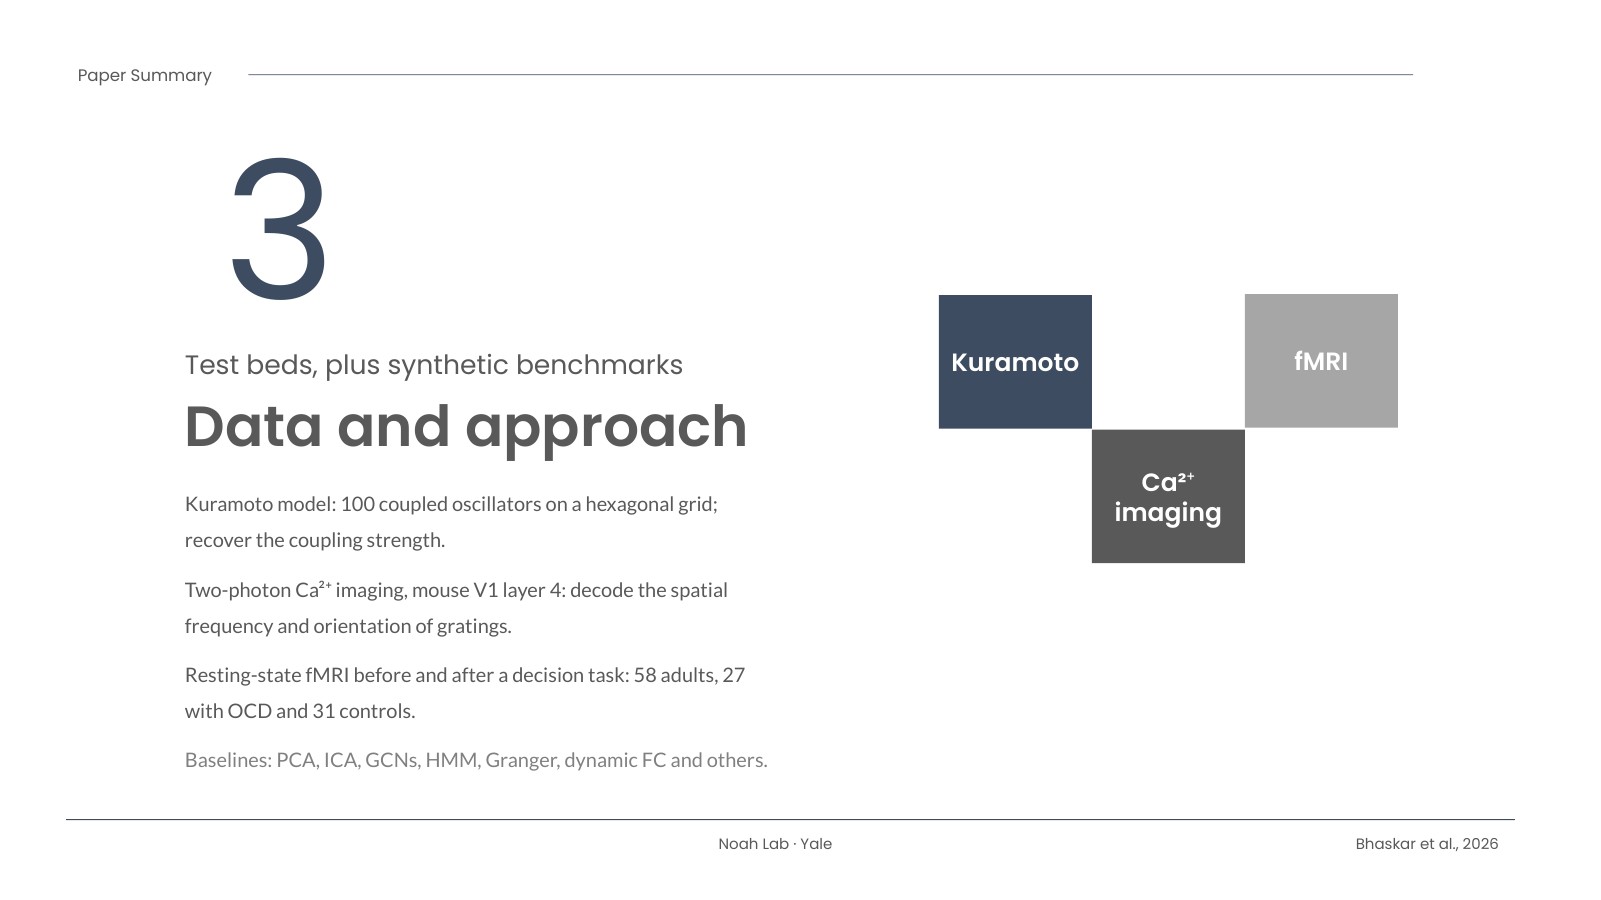
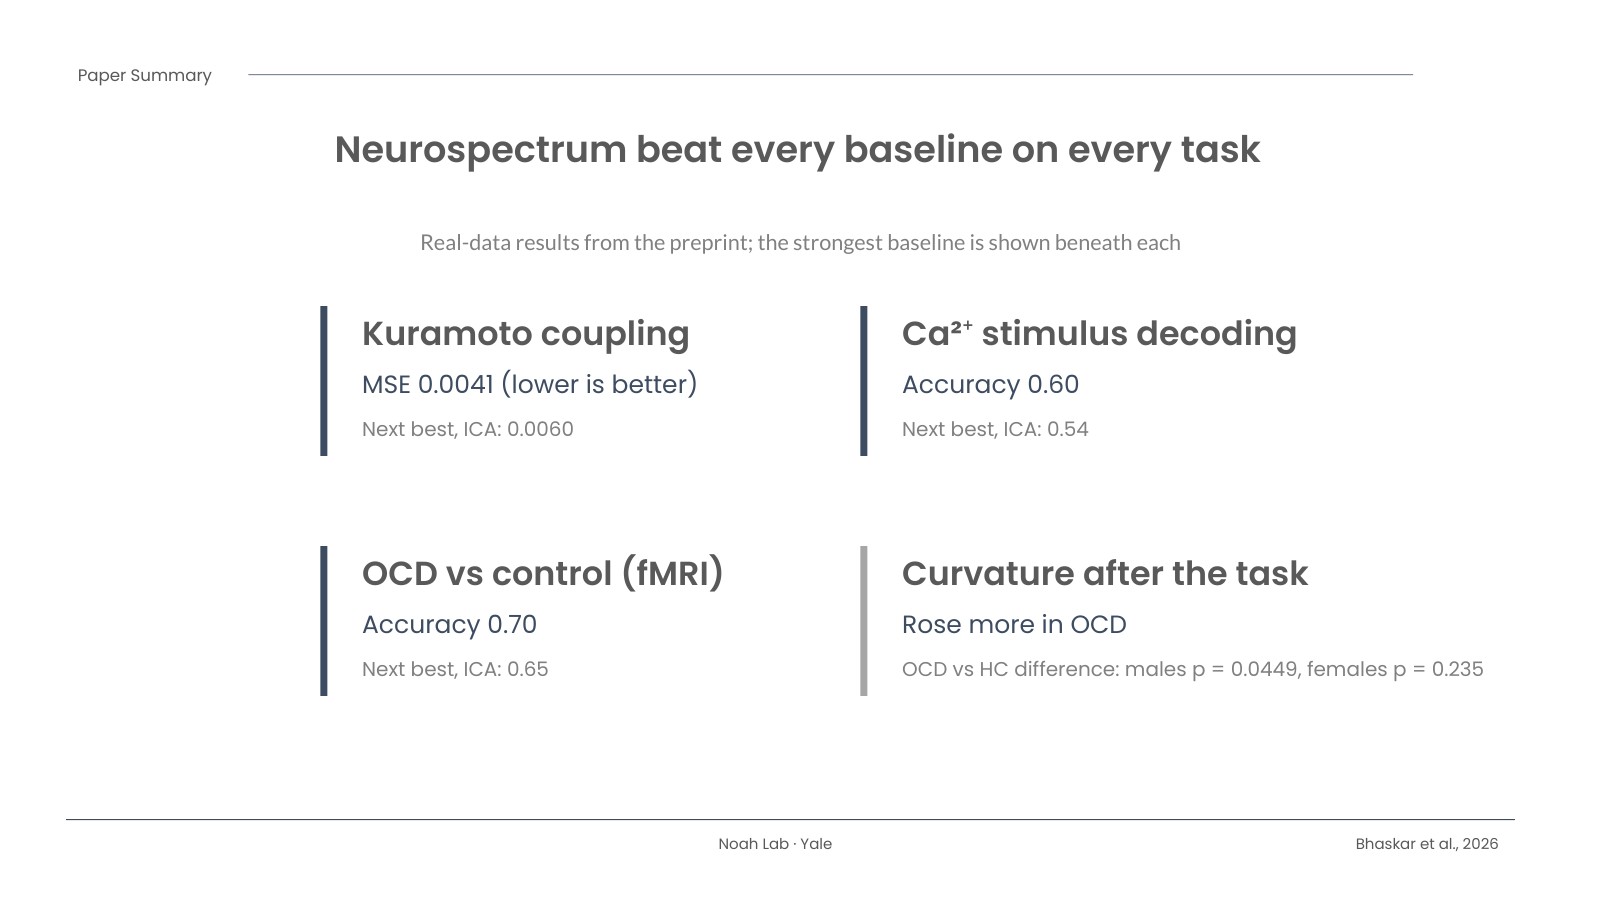
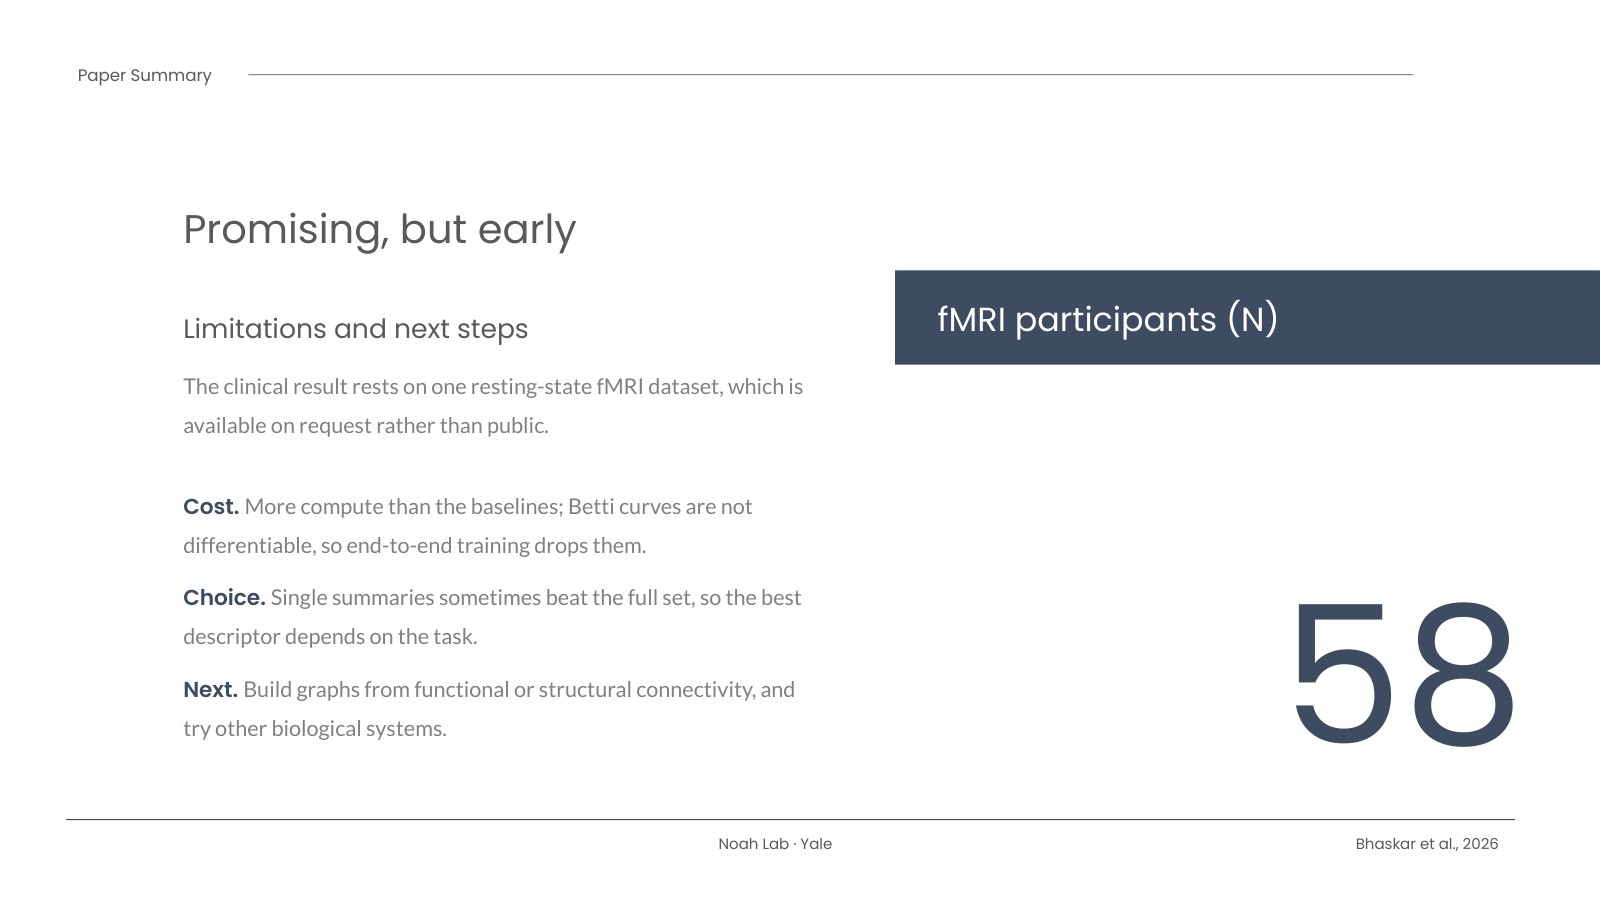
The team tested it on simulated coupled oscillators (the Kuramoto model, 100 oscillators), two-photon calcium imaging from mouse visual cortex, and resting-state fMRI collected before and after a decision-making task in 58 adults (27 with OCD, 31 healthy controls). Neurospectrum beat every baseline on every task. Recovering the oscillators’ coupling strength, its error was 0.0041 versus 0.0060 for the next-best method (ICA). Decoding the visual stimulus, accuracy was 0.60 versus 0.54. Telling OCD from control participants, accuracy was 0.70 versus 0.65.

The part I find most interesting: after the task, people’s brain trajectories bent more sharply, and that rise in curvature was larger in OCD. The group difference was statistically significant in males (p = 0.0449) but not in females (p = 0.235). The attention maps also pointed to different regions by sex, such as the posterior putamen in female participants and the superior frontal sulcus in male participants.

Why it matters

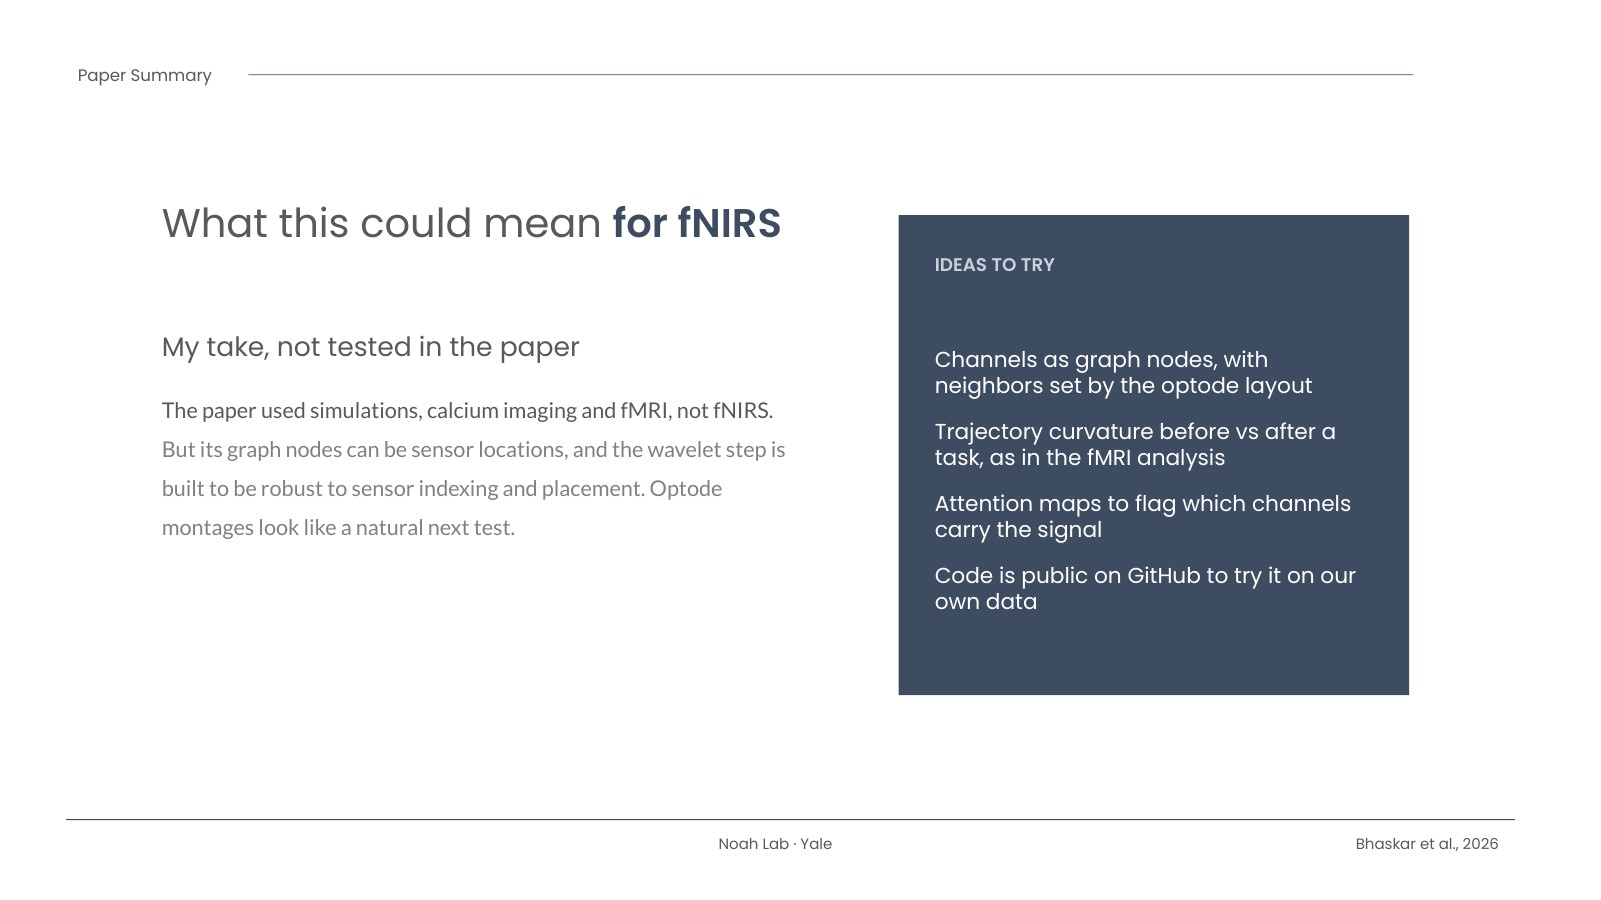
This isn’t just a better classifier. It produces features you can look at and reason about, like how much a brain state “turns” after a task, or which regions drive a difference. The paper didn’t use fNIRS, but the graph nodes can be sensor locations, and the wavelet step is designed to be robust to differences in sensor indexing and placement. That makes fNIRS optode montages a natural next test, and I’d like to try it. There are caveats: the clinical result rests on a single fMRI dataset, the method costs more compute than simpler tools, and the best summary feature depends on the task. The numbers above are from the open preprint, and the code is on GitHub.

Read the paper

Article (DOI): https://doi.org/10.1016/j.neucom.2026.135412
Open preprint (bioRxiv): https://doi.org/10.1101/2023.03.22.533807

Citation: Bhaskar D, Zhang Y, Moore J, Ketonis P, Gao F, Grossenbacher-Rieck B, Wolf G, Khasawneh FA, Munch E, Noah JA, Pushkarskaya H, Pittenger C, Greco V, Krishnaswamy S. Neurospectrum: A geometric and topological deep learning framework for uncovering spatiotemporal signatures in neural activity. Neurocomputing. 2026;710:135412. doi:10.1016/j.neucom.2026.135412

The slides

Here is my eight-slide summary of the paper. Use the arrows, your keyboard’s arrow keys, or the thumbnails, and hit Fullscreen for a bigger view.

Title slide: Neurospectrum, a geometric and topological deep learning framework for uncovering spatiotemporal signatures in neural activity, with the full citationBackground slide: neural signals are hard to read; common tools versus NeurospectrumData and approach slide: Kuramoto simulations, calcium imaging and fMRI test bedsMethod slide: graph, trajectory, shape, with a schematic of the Neurospectrum pipelineResults slide: Neurospectrum beat every baseline on every task, with four key numbersSlide: what this could mean for fNIRS, ideas to tryLimitations and next steps slide, with 58 fMRI participantsReference and links slide with the DOI, preprint and code links
1 / 8

Download the slides (PowerPoint)

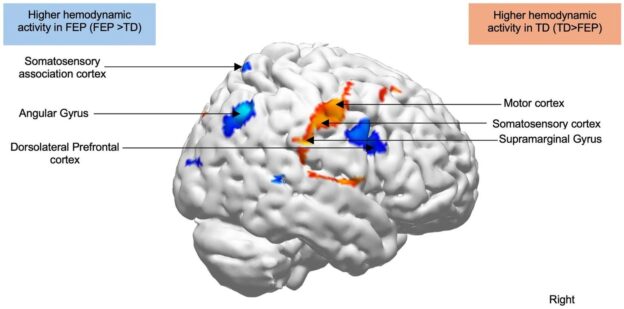
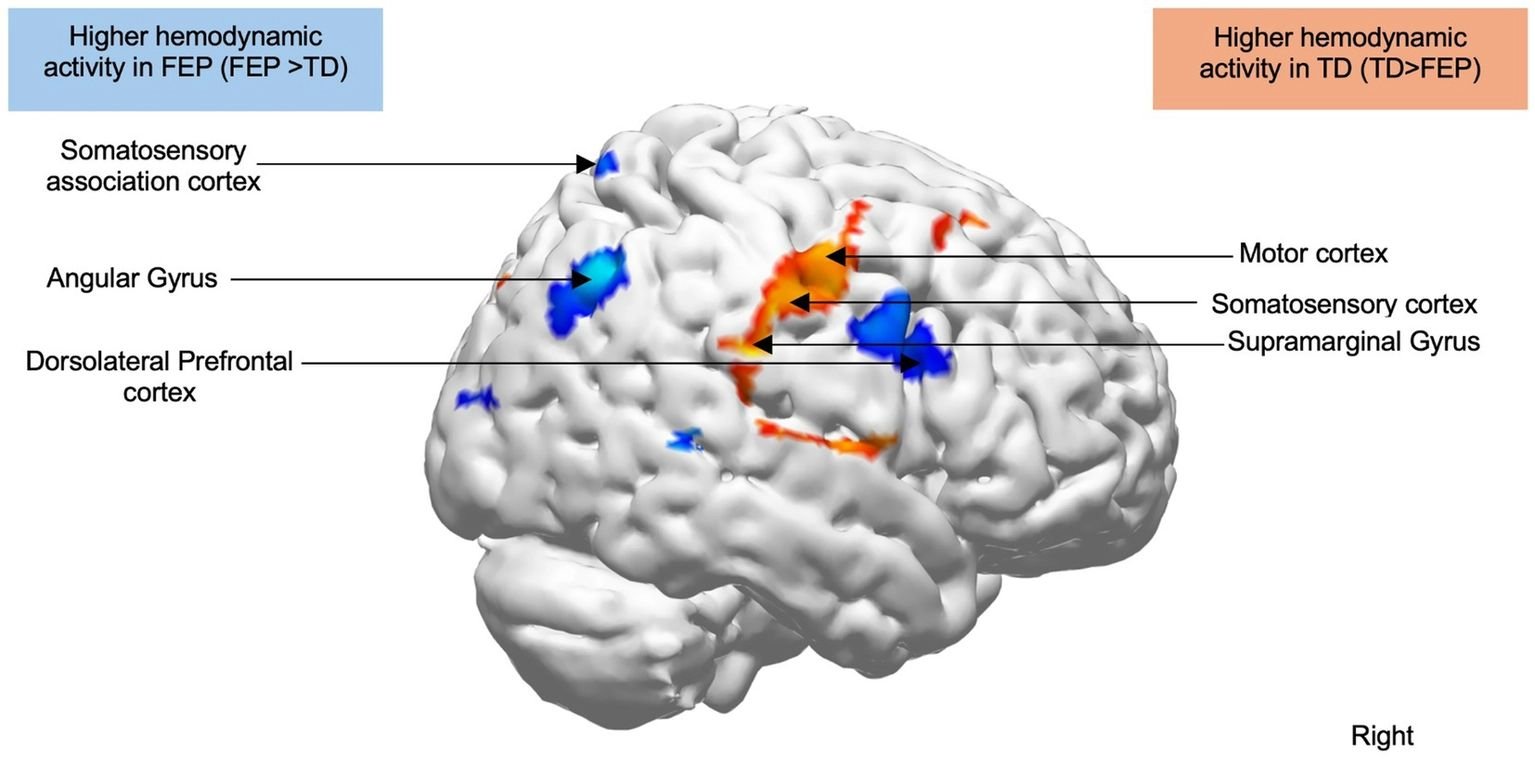
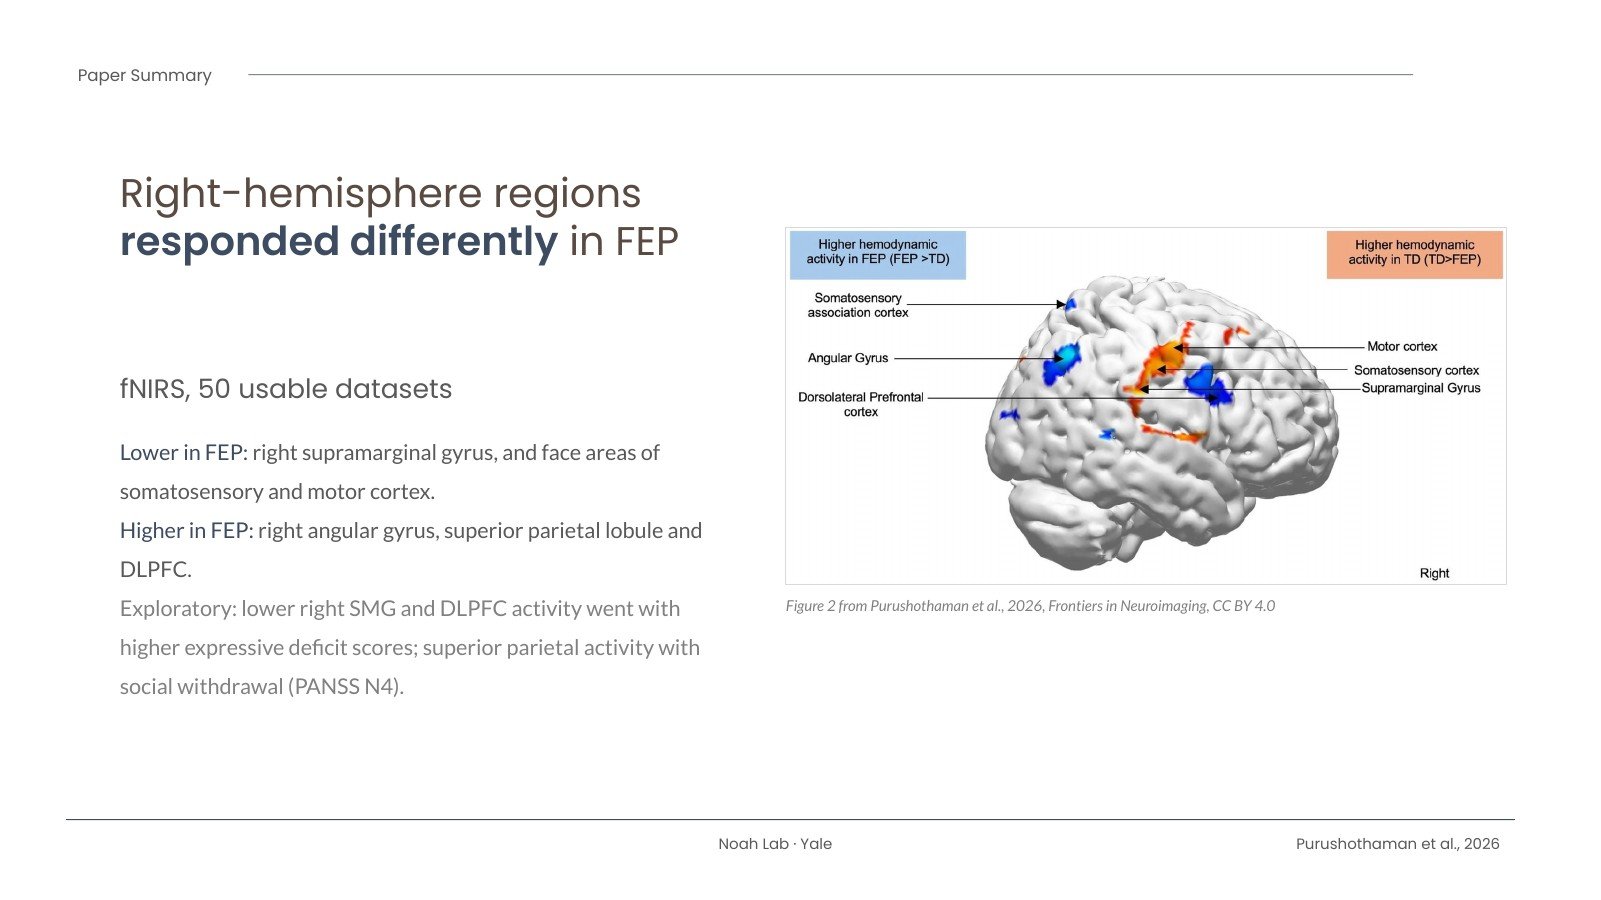
Right-hemisphere brain rendering from Figure 2 of Purushothaman et al. 2026: red-yellow clusters (supramarginal gyrus, somatosensory and motor cortex face areas) show lower activity in first episode psychosis than in typically developed participants; blue clusters (angular gyrus, somatosensory association cortex, dorsolateral prefrontal cortex) show higher activity.

Looking at a Live Face: What We Learned About Early Psychosis

Our new paper is out in Frontiers in Neuroimaging, led by Deepa Purushothaman with Xian Zhang, Rahul Singh, Cenk Tek, Vinod Srihari, Joy Hirsch and me. It asks a simple question with a complicated answer: what is different in the brain when someone early in the course of psychosis looks at another person’s face, live, in the same room? The article is open access: read it here (doi:10.3389/fnimg.2026.1931240).

The problem

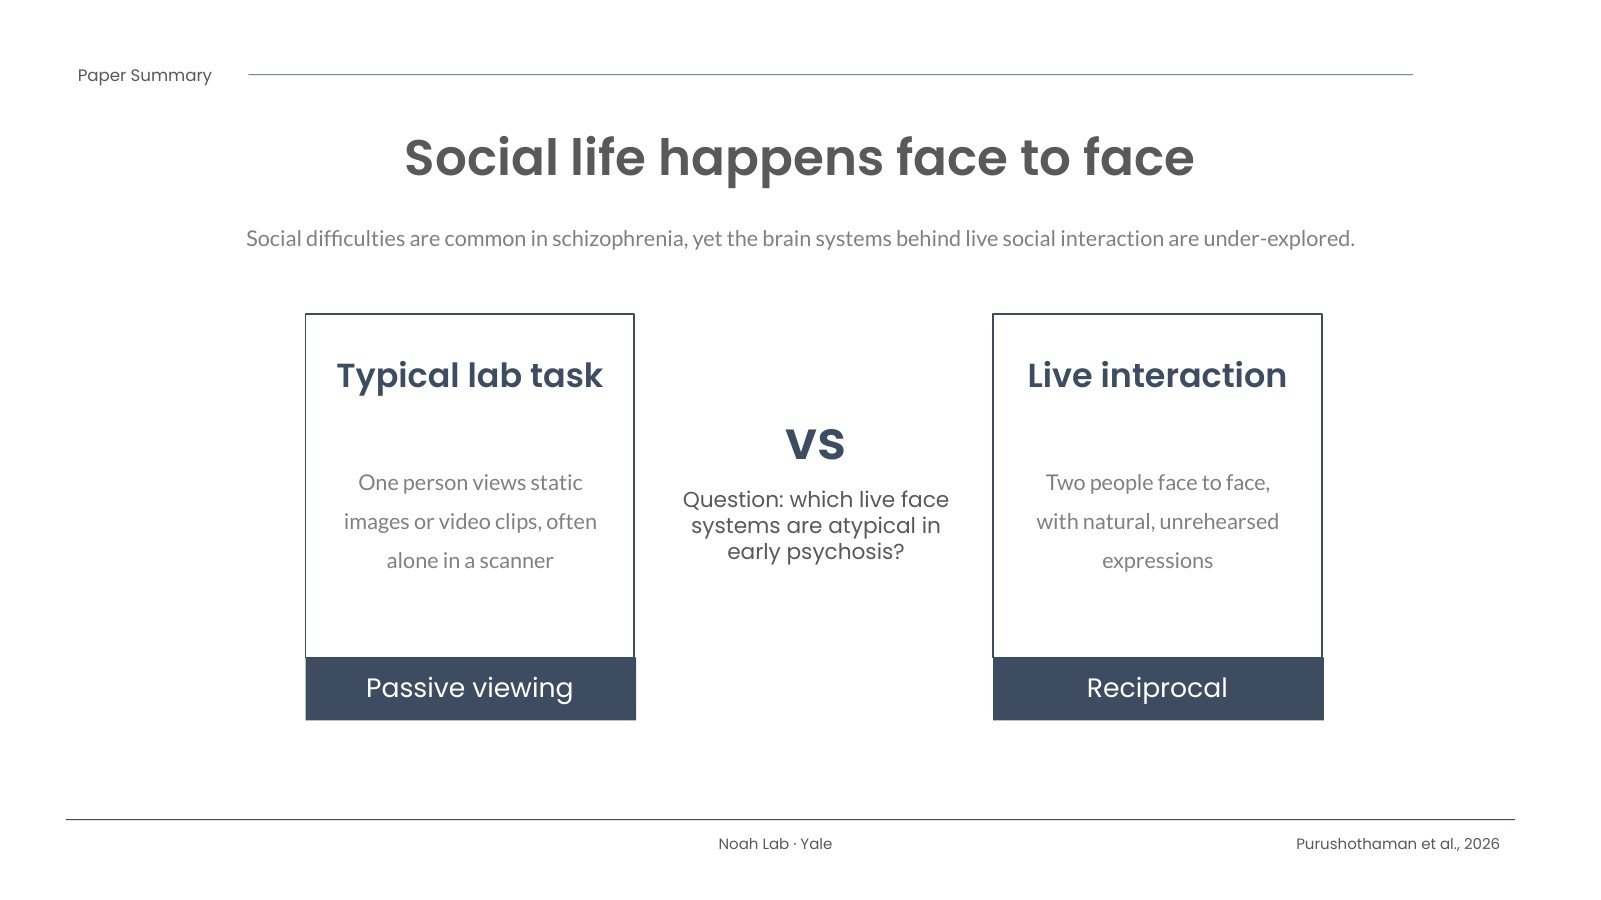
Difficulties with social interaction are common in schizophrenia, and they matter a great deal for how people do in daily life. Yet most of what we know about the social brain in schizophrenia comes from people looking at photos or video clips, usually alone, lying in a scanner. Real conversations aren’t like that. They are face to face, reciprocal and unscripted, and our earlier work suggests the brain handles a live face differently from a face on a screen.

What we did

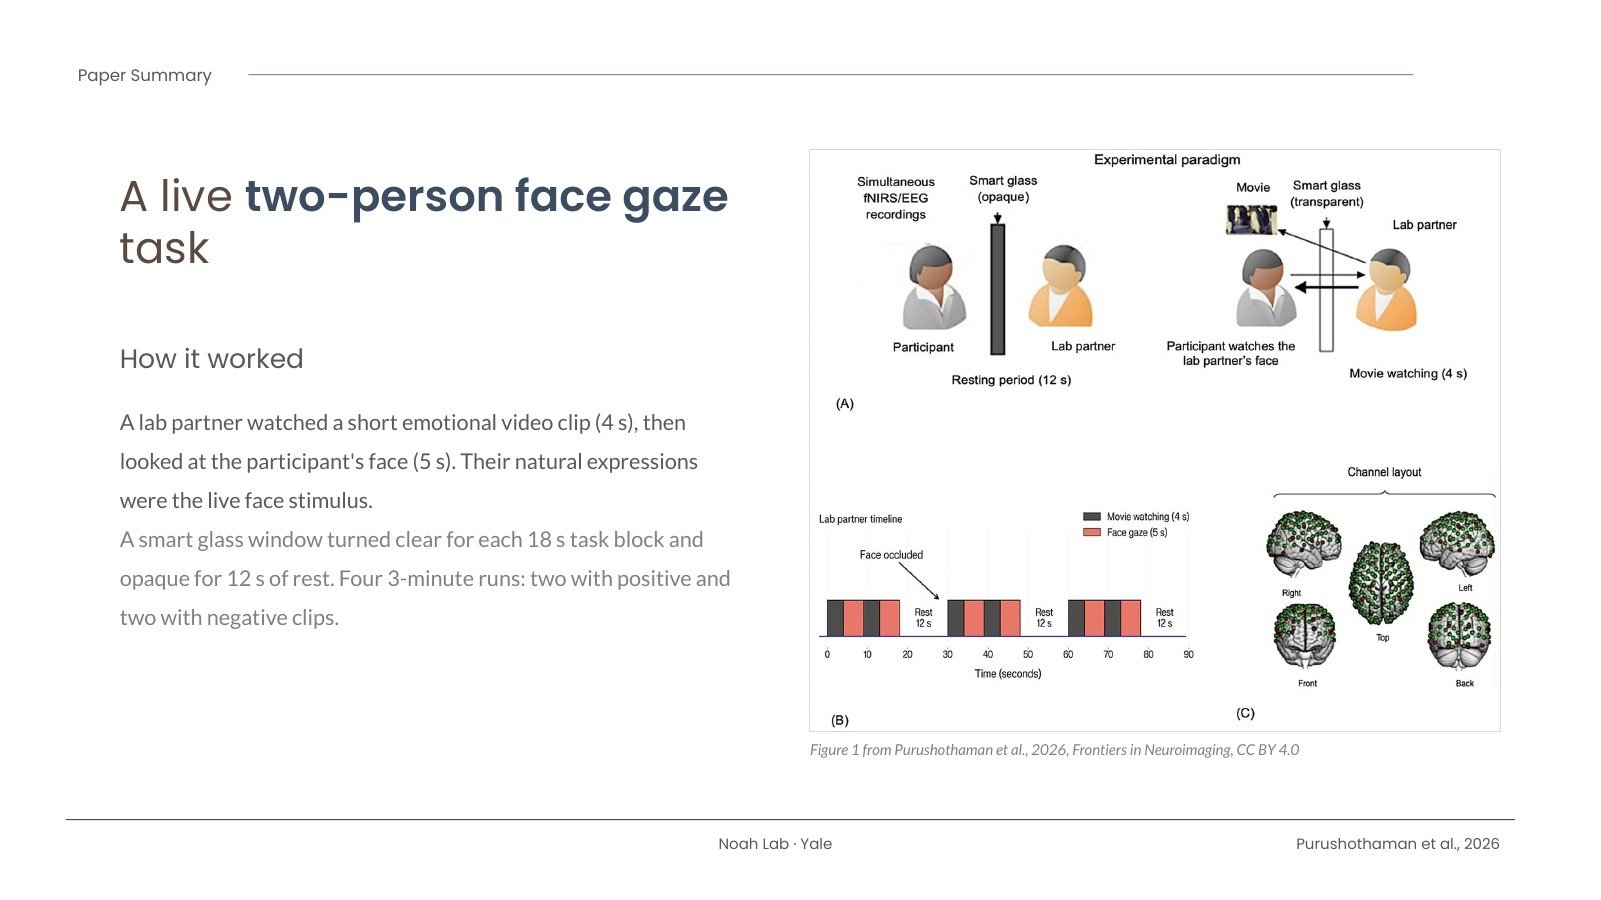
We used a two-person face gaze task that our lab has used before. A lab partner sat across a table from each participant, separated by a “smart glass” window that could switch from opaque to clear. The partner watched short, emotionally evocative video clips (cute animals, or things like spiders and decay) and then looked at the participant, so the participant saw a real person’s natural, unrehearsed expressions.

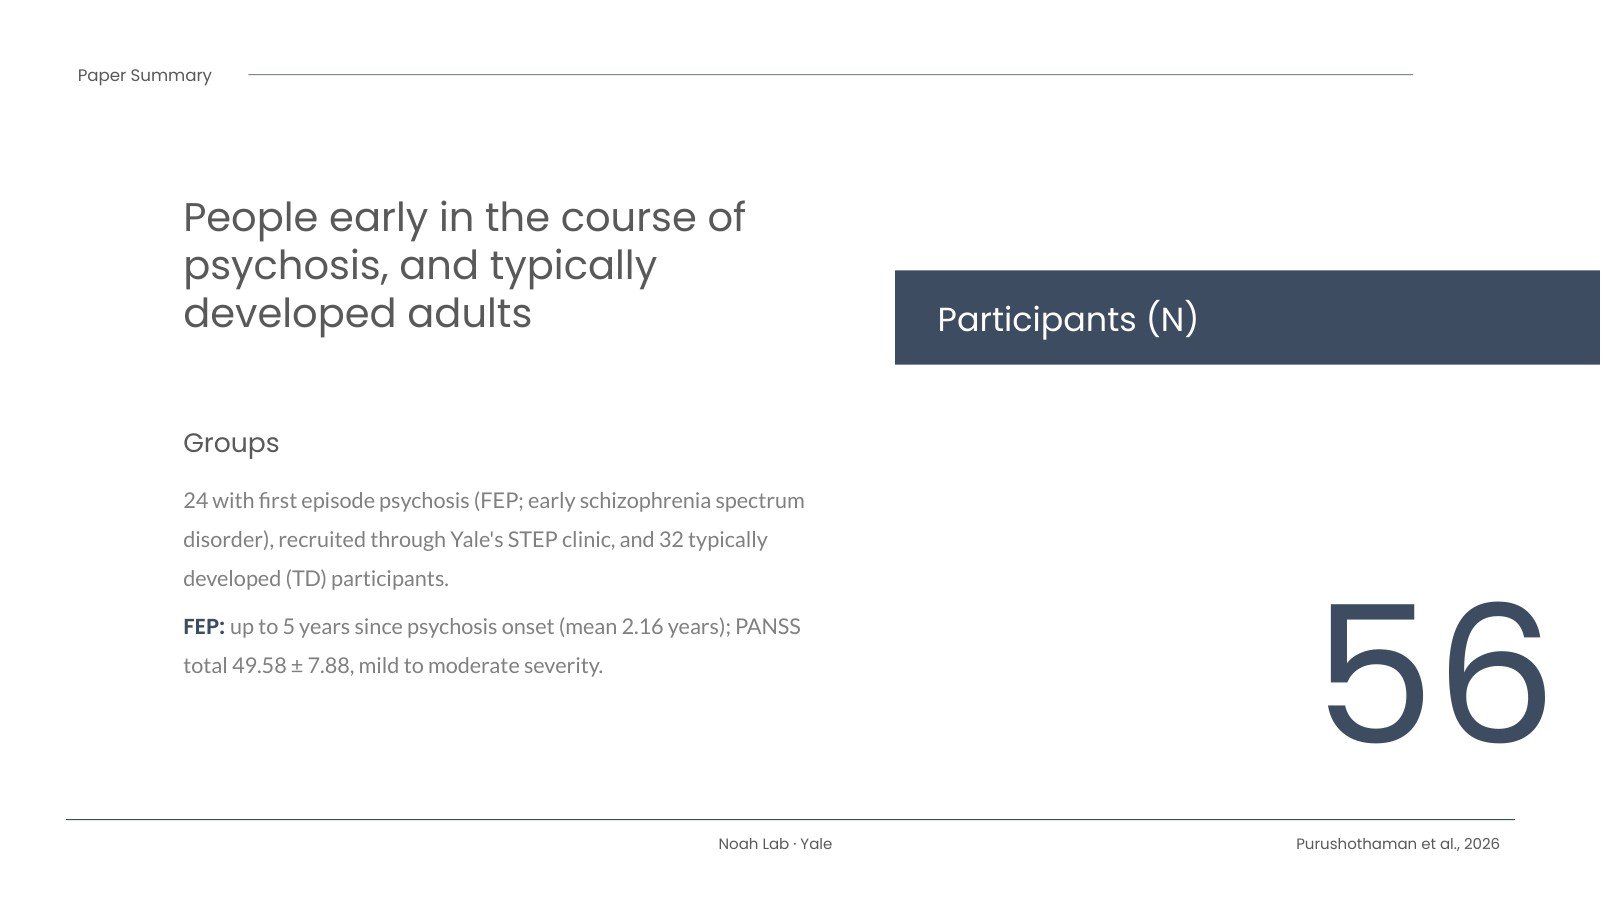
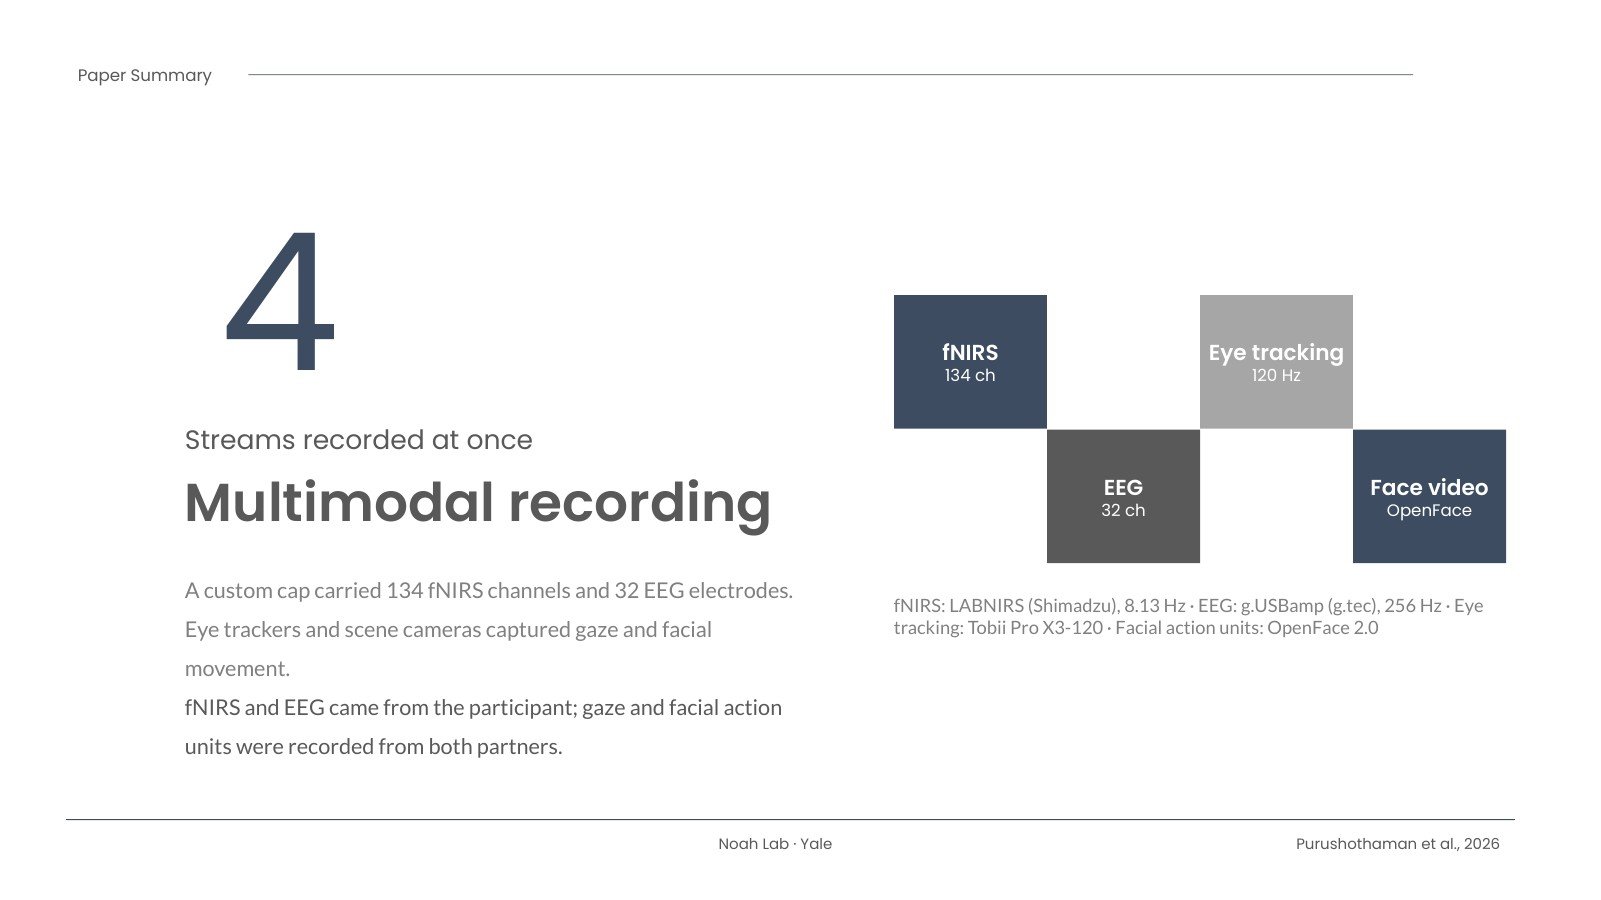
While this happened we recorded several things at once: fNIRS (134 channels) and EEG (32 electrodes) from a single cap, eye tracking, and video of facial movements analyzed with OpenFace. We compared 24 people with first episode psychosis (early schizophrenia spectrum disorders), recruited through Yale’s STEP clinic, with 32 typically developed participants.

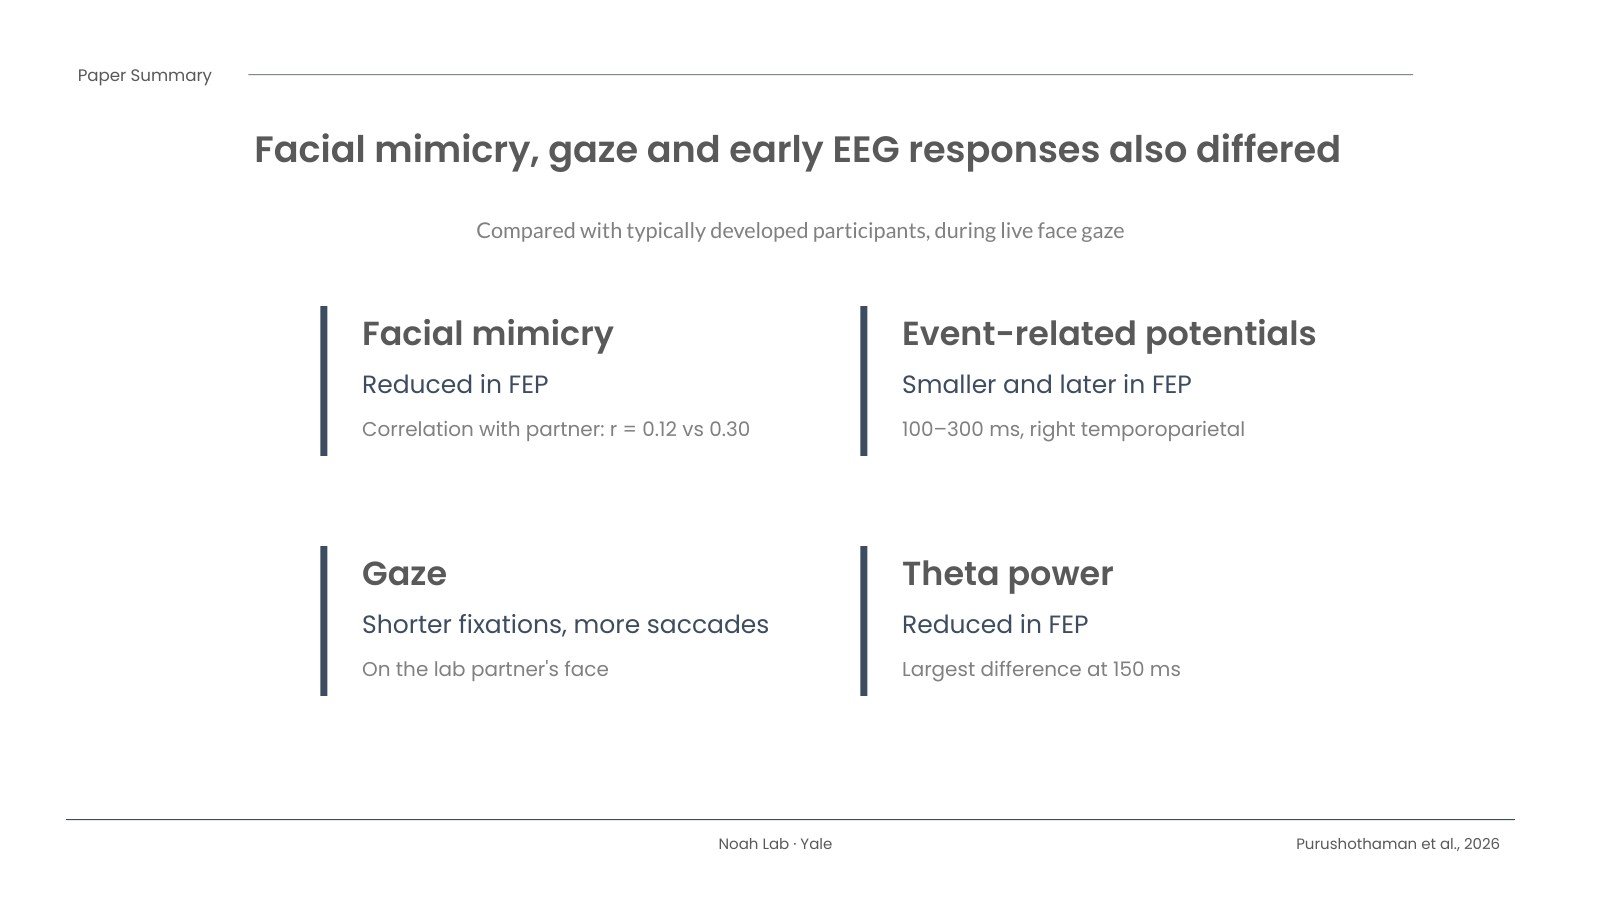
Right-hemisphere brain rendering from Figure 2: red-yellow clusters (supramarginal gyrus, somatosensory and motor cortex face areas) show lower activity in first episode psychosis than in typically developed participants; blue clusters (angular gyrus, somatosensory association cortex, dorsolateral prefrontal cortex) show higher activity.
Brain regions where activity during live face gaze differed between groups. Red-yellow: lower in first episode psychosis; blue: higher. Figure from Purushothaman et al., 2026, Frontiers in Neuroimaging, CC BY 4.0.

What we found

Activity in a set of right-hemisphere regions differed between the groups. The right supramarginal gyrus, a region we have repeatedly linked to live face gaze, along with the face areas of the right somatosensory and motor cortex, was less active in the first episode psychosis group. The right angular gyrus, superior parietal lobule and dorsolateral prefrontal cortex were more active.

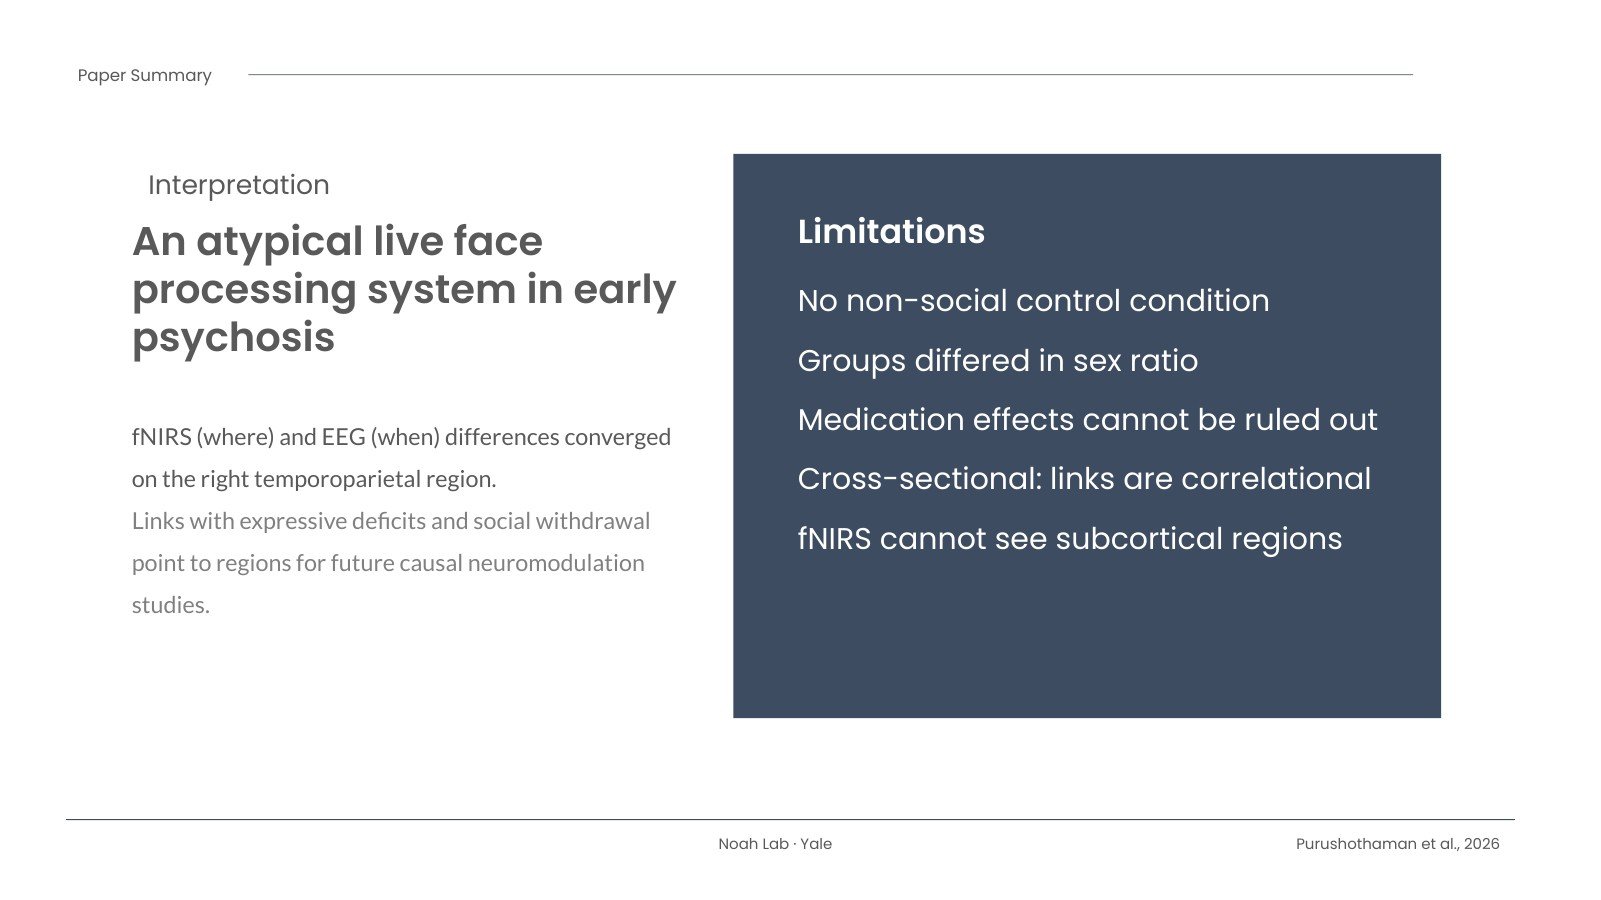
In exploratory analyses, lower activity in the right supramarginal gyrus and DLPFC went with higher expressive deficit scores (blunted affect, poor rapport, less spontaneous conversation and slowed movement), and activity in the superior parietal region went with passive social withdrawal.

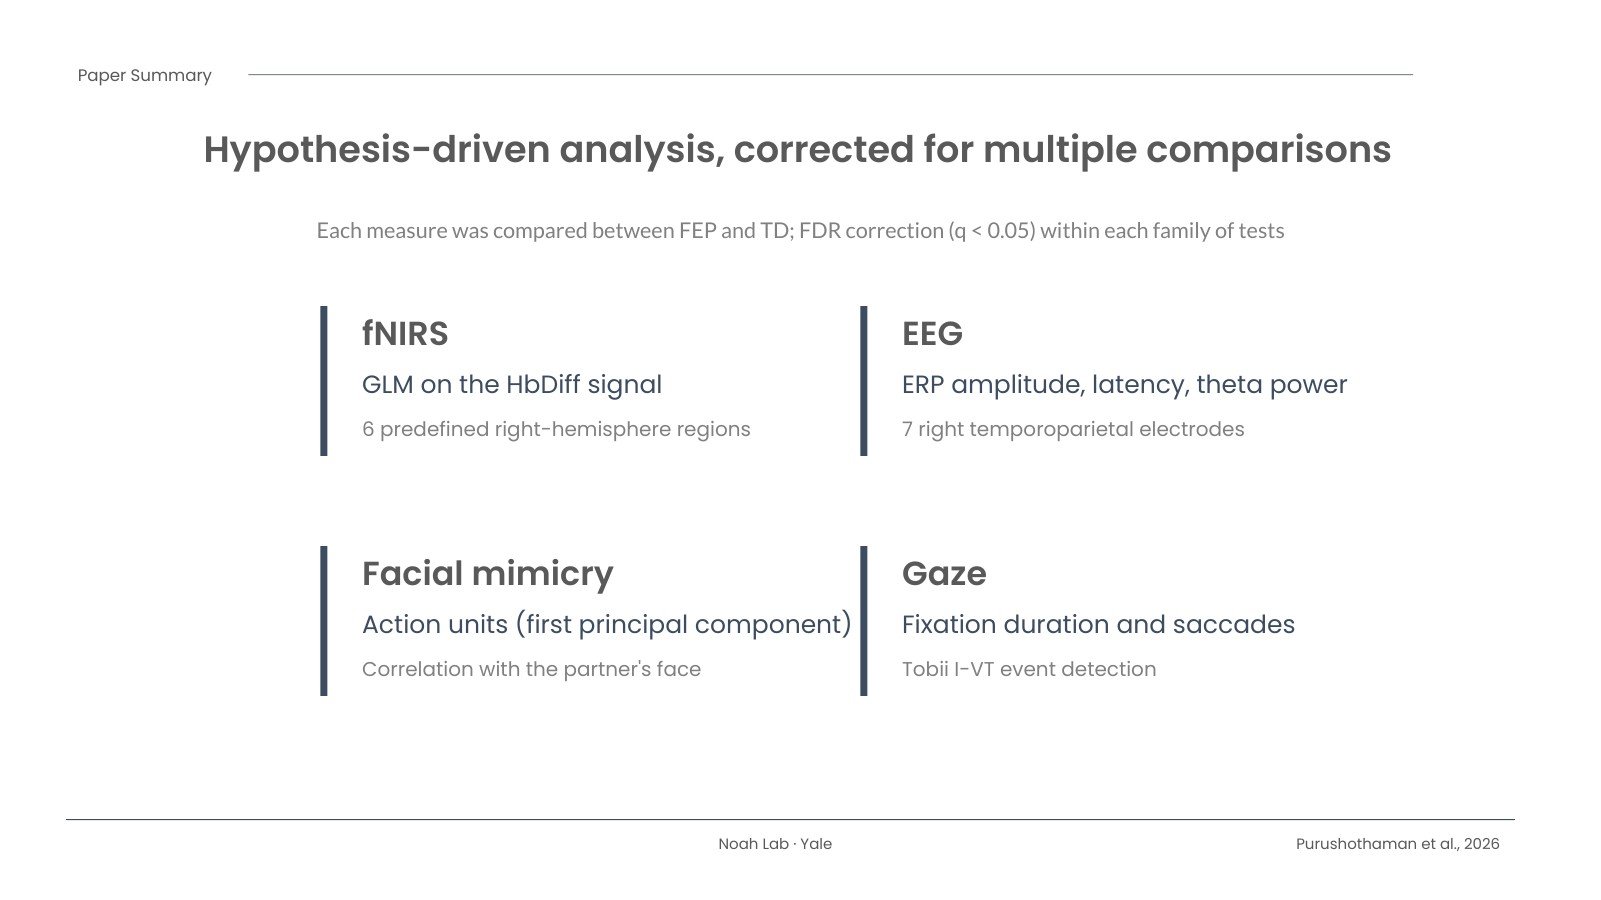
Behavior and EEG told a consistent story. Participants with first episode psychosis showed less spontaneous facial mimicry of their partner, shorter fixations on the partner’s face and more frequent saccades. In the first 100 to 300 milliseconds after the window cleared, their EEG responses were smaller over right temporoparietal electrodes and delayed over temporoparietal electrodes on both sides, and theta power was reduced. So the “where” from fNIRS and the “when” from EEG pointed to the same right temporoparietal area.

Why it matters, and what it doesn’t show

This is a step toward measuring social brain function in a setting that looks more like everyday life, at a stage of illness when people may benefit most from new kinds of support. The regions we found could become targets for future studies that test cause and effect, for example with non-invasive neuromodulation.

It is also important to be clear about the limits. The study is cross-sectional, so these links are correlational. There was no non-social control condition, the groups differed in sex ratio, most participants with psychosis were taking medication, and fNIRS can’t see deeper brain structures. We hope this work helps build better tools, not labels. I’m grateful to everyone who took part.

The slides

Here is a short slide summary of the paper. Use the arrows, your keyboard, or the thumbnails to move through it.

Slide 1: Title and citationSlide 2: Background and questionSlide 3: ParticipantsSlide 4: The live face gaze taskSlide 5: Multimodal recordingSlide 6: AnalysisSlide 7: fNIRS resultsSlide 8: Behavior and EEG resultsSlide 9: Interpretation and limitationsSlide 10: Reference and links
1 / 10

Download the slides (PowerPoint)

Read the paper

Purushothaman D, Noah JA, Zhang X, Singh R, Tek C, Srihari VH, Hirsch J. A multimodal approach to identify atypical face processing in first episode psychosis (early schizophrenia spectrum disorders). Frontiers in Neuroimaging. 2026;5:1931240. doi: 10.3389/fnimg.2026.1931240

The article is open access under a CC BY 4.0 license. The data are available through Dryad: doi:10.5061/dryad.gxd2547xn.

Lasers, magnetism allow glimpses of the human brain at work

AP Article by Malcolm Ritter (June 22, 2015): “Lasers, magnetism allow glimpses of the human brain at work”  Also appeared on the NY Times and the Hartford Courant.  Video below (with original link to YouTube here:

IMG_20150312_115456 IMG_20150312_115534 IMG_20150312_115422